 Estimated time: 4 minutes.
In this lesson, you will get a quick view of Toluene measurements for a single date, as entered for the project's boreholes, by generating 3D logs for the currently-enabled boreholes.
- To create the 3D logs, click on the Striplogs menu, and choose 3-Dimensional and Multiple Logs.
This window has several sections:
The left side is where general diagram settings are established.
The 3D Striplog Designer tab is where you establish the log-specific settings.
- Establish the general diagram settings in the left pane.
- Group Title: This can be left at: Logs
 Clip: Uncheck this.
- Reference Cage: Uncheck this.
- Include Lithology Legend: Uncheck this.
- Include Stratigraphy Legend: Uncheck this.
- Include Well Construction Legend: Uncheck this.
- Click on the 3D Striplog Designer tab.
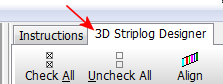
- The left pane of this tab is where you choose what type of data is to be displayed in the logs (the Visible Items).
- The upper-right pane is where you see a plan-view Preview of the active log items. You can drag the items to adjust their relative placement.
- The lower-right pane displays specific Options for the Visible Item that you click on.
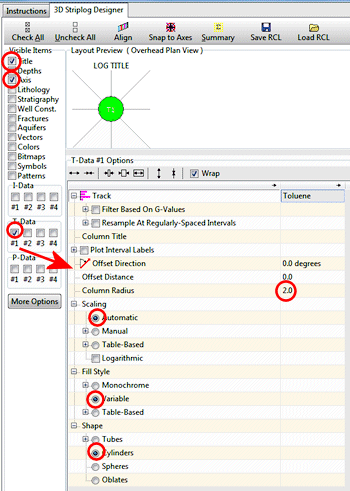
- Choose the items you want to see in the logs by inserting a check-mark in the following items in the Visible Items section of the window:
 Title: The drill hole name will plot above the logs.
- Axis: The logs' axes will be shown with a solid line.
- T-Data #1: The logs will contain a column illustrating time-interval measurements. You can include up to 4 different T-Data components or dates; we'll display only one in this lesson.
When this column is selected, you'll see a green circle displayed in the plan-view Preview pane.

- Track: At the top of the Options pane, click on the Track heading and choose Toluene as the data to be represented in the logs.
Expand the Track heading to access the data filter options.
- Filter Based on G Values: Be sure this is left un-checked. In your own work this can be used to display only high or low values in your logs.
- Resample at Regularly-Spaced Intervals: Be sure this is also left un-checked. In your own work, these settings can be used to thin the number of downhole measurements displayed (for densely sampled drillholes) or to include zero-value "bogus" points to add control to sparsely-sampled holes.
- Column Title: This should be blank. If text is displayed for this prompt, click on this heading and delete the text.
- Plot Interval Labels: Leave this unchecked (it's used to plot value labels down the log).
- Offset Direction: This should reflect the current offset, in azimuth degrees, from the axis of the log. It can be left at zero.
- Offset Distance: Adjust the placement of the column relative to the axis of the log by dragging the circle in the Preview pane. Be sure the T-Data circle is on the center of the log axis.
! You can simply type 0.0 into the Offset Distance prompt, if you prefer.
- Column Radius: You can adjust the size of the column by dragging on one of the corner handles. Note the Column Radius setting in the lower-right Options pane. As you resize the circle, the Radius setting will be updated. Drag the T-Data #1 circle until the Column Radius is about 2.0.
! You can also simply type 2.0 into the Column Radius prompt.
- Scaling: Expand this heading and select Automatic.
- Fill Style: Expand this Options heading, and choose Variable. This will color-code the logs based on Toluene values.
- Shape: Expand this Options heading, and choose Cylinders.
- None of the other Visible Items should be checked. Here's a summary of these settings:
- Now, set up the date filter for these T-Data logs, using the Rules and Filters pane to the right.
-
- Date / Time Filtering: Insert a check in this box to activate a date filter.
 Exact: Click in this radio button and click on the Date/Time Target prompt. Set the target date to 2/14/2007 (or 14/2/2007 for non-U.S. date formats). You can edit dates by clicking on the displayed month (or day or year) and typing in the preferred month/day/year. Or you can click the down-arrow to browse through an interactive calendar to select the date.

- Click the Process button at the bottom of the window to proceed.
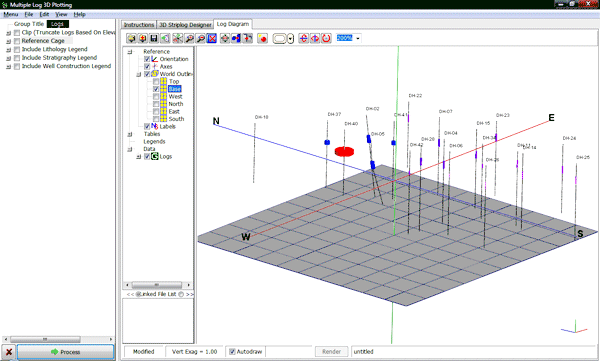
The program will create a log for each enabled borehole, including well name at the top, and color-coded Toluene cylinders displayed down the log. They will be displayed in a new, RockPlot3D tab.
The image is displayed in the pane to the right, and the image components as well as the standard reference items are listed in the pane to the left of the image. The expandable/collapsible list on the left is called the "data tree."
- Adjust the reference items:
- World Outline: Turn on the World Outline, by inserting a check in its check-box in the upper portion of the left-hand listing. You can expand the World Outline heading to specify which world items are enabled.
- Base: Turn on only the Base item - the remaining items can be unchecked.
- Axes: Be sure the 3D axes are turned on.
- Labels: Turn on the axis labels using this check box.
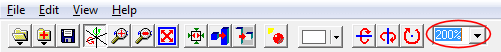
- Adjust the zoom: Click in the drop-down Zoom box on the toolbar, and choose 200%.
- Re-adjust the rotation
 if you wish, even when zoomed in. Use the Pan tool
  to move the current view back and forth, up and down. To zoom back out, just click once on the Zoom Out button
  .
.
- Turn on/off logs: Expand the Logs item in the data tree to the left, to see the individual boring names. You can turn entire logs on and off simply by checking/clearing their respective check-boxes. Try this for a few borings.
- Turn on/off log items: In addition, if you expand an individual borehole in the data list, you’ll see its title, axis, and data groups. These, also, can be turned on and off for each well.
- Save this 3D log data: Select the File | Save As command. In the displayed window, type in this name: toluene logs 2-14-07 and click the Save button. RockPlot3D will save this information on disk under that name, with an ".Rw3D" file name extension. In later lessons, you can append these logs to other 3D diagrams.
- Close the RockPlot3D window by clicking in the Windows Close button
 .
.
 3D Logs
 Back to T-Data menu | Next (2D log section)

RockWare home page