 Estimated time: 3 minutes.
In this lesson, you will look at how downhole "Time Interval" or "T-data" is entered, how the columns are defined, how to edit the data as a "datasheet", and how to do a simple query.
- Be sure the "Samples" folder is still the current project folder (see Open a Project for information).
- In the borehole file listing along the left side of the Borehole Manager, click on the borehole named DH-14 to make it active, and then click on the T-Data button to view that table.

! Note how each row contains a top and bottom depth, a date, and 2 columns of measurements. There is no strict limit to the number of measurement columns you can define. These values can represent pollutant concentrations or any quantitative measurement taken over a depth interval with a date/time record. If a component has no measurement for that interval or date, it can be left blank.
The depth intervals may correspond to a screened interval, in which case they could be the same for each listed date. Or, they may correspond to water levels, or other sampling intervals. Both depths are required.
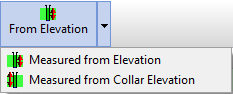
The depths can be referenced to the ground surface (default) or to the top of the casing, using the From Elevation button at the top of the table.
The format of the date fields will match the date format you have established in Windows, such as mm/dd/yyyy format in the U.S. or the dd/mm/yyyy format used in many other parts of the globe.
- Look at the project's T-Data Types:
- Click on the T-Data Types button at the top of the T-Data listing. The program will display the current T-Data column setup.

This defines for each component type its name and its min and max values. You can also enter comments regarding units and descriptive notes. The Visible checkbox determines whether the column is displayed or not in the Borehole Manager. In your own work you can add new components to the T-Data table (and columns to the Borehole Manager display) by clicking in the last shown row, pressing the down-arrow key, and defining these fields for the new measurement type.
- Click on the Close button to close the Time (T-Data) Columns window.
- Edit Data as Datasheet: Even though the data displayed in a borehole's T-Data table looks like a spreadsheet, it is not. It's actually a rather complicated merging of the information stored in the T-Data table and the T-Data Types table. Because of this, you cannot just click and drag to select a block of cells within a borehole's T-Data sheet like you can within a spreadsheet-type display, or copy/paste blocks of cells.
However, there is a nifty tool that makes editing this data quite easy.
- With the T-Data table still in view, click on the Datasheet button at the top of the data listing. (Or choose the Edit|Edit Data as Datasheet menu option.)
- The program will load the contents of the current T-Data table for the current hole into a row-and-column datasheet window. Here you can select blocks of cells, copy and paste from other applications (such as Excel), etc.
- Close this window by clicking the Cancel button, and respond Yes if the program displays a confirmation prompt.
- Query the Data: Let's use the basic query tool in RockWorks to view (and disable) any boreholes that do not have Toluene measurements >0 for a specific date.
- Choose the View| Filter Boreholes option. You'll see a window where there are number of data filtering options.
 Surface Region: Remove any checkmark from this box.
 Time Data Values: Check this box in the column along the left.
- T-Data name: Click the down-arrow button and choose the Toluene option.
- From, To: These will default to the defined data range for this component.
- Here, enter 0.1 for the minimum and leave the maximum at 500.
- From, To: These will default to the entire date range in the dataset.
- Set the From date to 2/14/2007 (or, if you're not in the U.S. your dates may appear as 14/2/2007). You can edit dates by clicking on the displayed month (or day or year) and typing in the preferred month/day/year. Or you can click the down-arrow to browse through an interactive calendar to select the date.
- To: Set this date also to 2/14/2007 (or 14/2/2007 as applicable).
- All other Select By... options should be left un-checked.
- Apply: Click the Apply button at the bottom of the window. You'll see a preview to the right, displaying in red those boreholes that contain Toluene measurements which are greater than 0.1 on this date. All other boreholes will be gray.
- Click OK.

Back at the Borehole Manager, you'll see a number of boreholes are now shown as inactive - they are no longer shown with check-marks. Disabled boreholes will not be displayed in maps or log displays, and their data will not be included in any modeling. We will leave some of these boreholes disabled for the next lesson only.
! The View | Filter Boreholes option uses an "AND" type of query, in which each of the boreholes for which every criterion is true will be enabled and the remaining boreholes will be disabled. The View | Select Boreholes option is more complex, allowing successive filters to be applied, and the enabling/disabling will apply only to the boreholes meeting the filter parameters, and no others. So, while the Filter Boreholes tool works as an AND filter, the Select Boreholes tool can function as an AND or OR filter.
 Entering T-Data
 Back to T-Data menu | Next (3D logs)

RockWare home page