 Estimated time: 3 minutes.
 In this lesson, you will create a single-panel cross section slice using the same T-data model used previously for the isosurface diagram.
! The instructions below are written with the assumption that you have completed the previous lesson, as well as the lesson on log sections.
- Click on the T-Data Menu and choose Profile.
- Establish the modeling settings:
 Use Existing Model: Since you took the time to create a T-data solid model in the previous lesson, we can use that one for this tutorial. Expand this item.
Model Name: Click here to browse for the file "toluene 2-14-07.RwMod".
! This is important to remember in your own work. Once a solid, numerical model is created to represent your data, and saved on disk as an .RwMod file, you can use that same model to create different types of diagrams – profiles, sections, fences, isosurfaces, slices – without having to reinterpolate the solid model each time.
- Establish the diagram options:
 Contour Lines: Uncheck this.
 Colored Intervals: Check this.
- Plot Logs: The program will project 2D logs onto the profile panel. If you want to review the 2D log settings (which you established in for the striplog section) you click on the 2D Striplog Designer tab to the right.
- Plot Surface Profile: This option can be either checked or not, as per the log section lesson.
- Create Additional Parallel Profiles: Uncheck this.
- Show Faults: Uncheck this.
- Perimeter Annotation: The defaults from the earlier lesson should work.
- Create Location Map.
- Next, establish the Profile location.
- Click on the Profile Selection Map tab. Any previous profile trace that you may have drawn in a separate session will be displayed.

- Select the profile location:
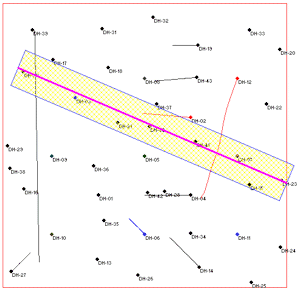
- Select the starting point for the profile cut by clicking on the borehole DH-30 near the northwest corner of the project area.
- Select the endpoint for the profile (you're picking a single slice only) by clicking on the borehole DH-23 in the middle of the eastern side of the project.
- Be sure that the swath to either side of the slice, within which the logs will be projected onto the diagram, is set to 20, using the prompt at the top of the window. This swath is represented by the yellow cross-hatching, as shown below.
- Click the Process to accept the modeling and diagram options, and the profile location.
The program will read the existing solid model (toluene 2-14-07.RwMod) and extract a panel along the indicated profile trace, with the indicated perimeter annotation. The bargraph logs will be projected perpendicularly onto the profile diagram. The map representing the panel trace will appended to the profile. The completed diagram will be displayed in a RockPlot2D window.
- You can use the check-boxes in the Layers pane to the right to turn on/off specific logs (or portions of logs which are projected onto the profile), panels, etc.
- You can save the section if you want, using the File | Save As menu command and entering a name of your choice.
- Close the profile window.
 T-Data Profiles
 Back to T-Data menu | Next (model new date)

RockWare home page