 Estimated time: 4 minutes.
The next two lessons are designed to show you how to create an Aquifer model and T-Data model for the measurements from a different date (following the same steps you've already gone through), and then morph the models into a "continuous" animation view.
 Before continuing, be sure you have completed the earlier lesson - creating a T-Data isosurface.
- Select the Aquifers | Model menu option to create the water surfaces for a new date.
- Choose Aquifer(s)
- Single Aquifer - Aquifer 1: Be sure this option is still selected.
 Hide Thin Zones: Uncheck.
- Plot Logs: Uncheck.
- Reference Cage: Uncheck.
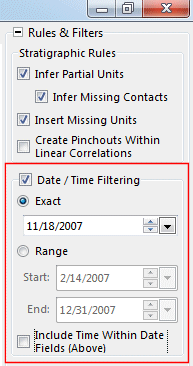
- Rules & Filters: In the right-hand pane of the options window, change the Exact date filter to 11/18/2007 (or, if you're not in the U.S. your dates may appear as 18/11/07).
- Click Process at the bottom of the Aquifer Modeling window.
The program will interpolate the water surface grids for this date and store them in the project folder. It will display the surfaces in a RockPlot3D window.
- Close the window; you do not need to save this view.
- Back at the Borehole Manager, click on the T-Data menu and select the Model option.
- Establish the modeling settings:
 Create New Model: Click in this button, and expand this item.
- T-Data Track: Be sure this is still set to the column titled Toluene.
- Solid Model Name: Click here to assign a name for the interpolated model, and type in: toluene 11-18-07
This will be the name assigned to the solid model to be created, with an ".RwMod" file name extension.
- Solid Modeling Options: Click on this button.
- Algorithms, Dimensions: The defaults from the last model are fine, with one exception:
 Superface: Be sure this is still checked, and click on this tab.
- Manual: Be sure this is still selected.
- Grid Model: Click here to browse for the file Aquifer 1_11_18_2007_top.RwGrd. (The number format in yours may be different.)
-
- Buffer Size: Set this to 0.0.
- Click OK to close the options window.
- Establish the diagram settngs:
- Create 3-Dimensional Diagram: Check this, and click on the Options button to the right to access the diagram settings.
- Diagram Type: Click here and choose Isosurface
- Iso-mesh: Uncheck.
- Cage: Check this.
- Click OK to close this window
- Plot Logs: Check this.
- Include Color Legend: Check this.
- Click Process at the bottom of the T-Data Model window.
RockWorks will construct the new solid model for the new date, using the new constraining water surface. The completed diagram will be displayed in a RockPlot3D tab.
- Feel free to experiment with the isolevel filter, transparency, and viewing options for this scene.
- When you are ready to continue, you can close the window. You do not need to save this view. (The solid model - the .RwMod file - has already been saved.)
 Back to T-Data menu | Next (morph)

RockWare home page