
RockWorks | Borehole Manager | StripLogs | 3-Dimensional | Multiple Logs + Linear Stratigraphic Correlations
Use this program to create a three-dimensional view of the strip logs of all enabled wells, displaying observed data entered into the borehole data tables. In addition, simple, straight lines will connect like formations in neighboring boreholes, along user-defined panels. The stratigraphy layers on the panels will be color-coded based on the formation's background color in the Stratigraphy Types Table. The completed diagram will be displayed in RockPlot3D.
Panels must be drawn between boreholes.
Correlation panels can be drawn between vertical, inclined, and deviated holes; for the latter the panels are connected to interval tops and bases only.
See also
Interpolated Stratigraphic Fence Diagrams for grid-based stratigraphic fence diagrams
Log-Only 3D diagrams
What is a Hole to Hole Fence
Stratigraphy Rules
Menu Options
Step-by-Step Instructions
Menu Options
- Hang Section on Datum: Insert a check in this check-box if you want the fence panels to be built with a particular formation set to "0" elevation. All other data will be plotted relative to that interval. Expand this heading to specify the formation name.
- Stratigraphic Unit: Click on this item, and the program will display the formations listed in the current Stratigraphy Types Table. Select the formation on which the section is to be hung. (More.)
WARNING: Logs and section panels can only be hung for boreholes which actually contain the selected unit. It is highly recommended that you disable the holes in which the unit is not present so that you cannot pick them for your section and their 3D logs won't be displayed. (See Querying the Database - Stratigraphy Example.)
- Include Stratigraphy Legend: Insert a check here to include a listing of the formation names along with their represented colors in the 3D diagram.
- Expand this item to establish the size, position, etc. (More.)
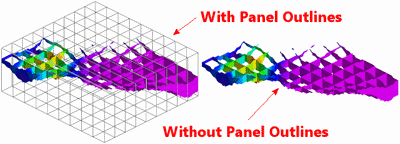
- Plot Outline Around Each Panel: Insert a check here to include a solid-line outline around each fence panel, and expand the heading to define the line style and color. Leave this option un-checked to omit the outline.
- Plot Surface Profile: Insert a check here to include a solid line profile on each fence panel that represents a user-selected grid model, typically the ground surface.
- Expand this heading to select the name of the grid model to be represented in the surface profile and to establish the profile settings. (More.)

- Plot Logs: Check this box to append striplogs to your stratigraphy panels.
! Note that 3D logs for all active boreholes will be appended to the 3D diagram.
- Clip : Insert a check in this box if you want to display a subset of the log data in the diagram. You can clip the 3D logs along any axis.
- Expand this heading to define the X, Y and/or elevation range to be displayed. (More.)
- 3D Striplog Designer: Click on the 3D Striplog Designer tab to the right, to select the items to display in the individual logs.
-
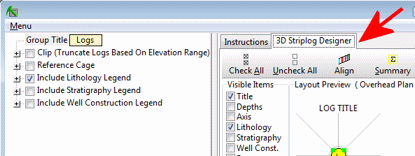
- Visible Items: Use the check-boxes in the Visible Items column to select which log items are to be displayed. See Visible Item Summary for information.
- Options: Click on any of the Visible Items names to see the item's settings in the Options pane to the right. See Visible Item Summary for links to the Options settings.
- Layout Preview: For each item you've activated, you'll see a preview cartoon in the upper pane, showing an overhead view of the log columns. Click and drag any item to rearrange the log columns; click and drag the circle handles to resize a column. See Using the 3D Log Designer.
- Reference Cage: Insert a check here to include in the diagram a 3D frame with coordinates and elevation labels.
- Expand this heading to access the cage options. (More.)
- Create Location Map: Insert a check here to have the program create, along with the fence diagram, a reference map that shows the panel locatiosn.
- Expand this heading to establish the map options. (More.)
-
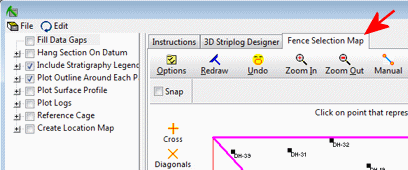
- Fence Selection Map: Click on the Fence Selection Map tab to the right, to draw where the fence panels are to be placed. The most recent panels drawn for this project will be displayed. (More.)
- Rules and Filters: Use the settings on the far right side of the window to select the appropriate stratigraphic rules to apply to this diagram. (More.)
Step-by-Step Summary
- Access the Borehole Manager program tab.
- Enter/import your data into the Borehole Manager database.
You might refer to the Stratigraphy Rules and Missing Formations topics regarding the best way to deal with including/not including absent formations.
- Select the Borehole Manager | StripLogs | 3-Dimensional | Multiple Logs with Linear Stratigraphic Correlations menu option.
- Enter the requested menu items, described above
- If you are including logs, be sure to click on the 3D Striplog Designer tab to establish how you want the logs to look.
- Be sure to click on the Fence Selection Map tab to select the fence panel locations.
- Click on the Process button to create the 3D log display with correlation panels.
The program will look at the coordinates specified for each fence panel, snap the endpoints to the closest borehole coordinate if necessary, and construct a vertical panel with linearly-correlated units to illustrate the stratigraphic elevations. The intervals will be filled with the colors defined for the strata in the Stratigraphy Types Table. This process will be repeated for each fence panel you drew. If you requested that logs be plotted, the 3D logs will be generated and added to the fence panels. The completed view will be displayed in a RockPlot3D tab in the Options window.
- You can adjust any of the following items and then click the Process button again to regenerate the fence diagram.
- Diagram settings in the Options pane on the left, and/or
- Striplog settings in the 3D Striplog Designer tab, and/or
- Fence location in the Fence Selection Map tab.
! Each time you click the Process button, the existing fence display will be replaced.
- View / save / manipulate / print / export the profile in the RockPlot3D window.
Tip: In RockPlot3D you can turn on/off entire panels as well as specific layers within each panel. Expand the Stratigraphy Fence item in the Data listing to access these settings.
 Back to StripLogs Menu Summary

RockWare home page