Model-based Fences: These are available within the RockWorks Borehole Manager'sLithology, Stratigraphy, I-Data, T-Data, P-Data, Fractures, Aquifers and Colors menus. They are used to display one or more vertical slices from the inside of a solid, stratigraphy, or aquifer model, to illustrate lithology distribution, stratigraphic or water level elevations, fracture proximity, or geochemical/geophysical values.
A Fence tool is also available within the RockWorks | Utilities | Solid menu, to slice an existing solid model containing any type of data.
Selecting the Fence Panel Locations
Importing/Exporting the Fence Panel Locations
Notes
Selecting the Fence Panel Locations
- Select the Fence tool from the Lithology, Stratigraphy, I-Data, T-Data, P-Data, or other menu.
- Establish the diagram-specific settings using the options which are listed in the left side of the program dialog.
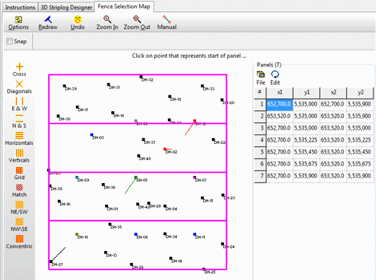
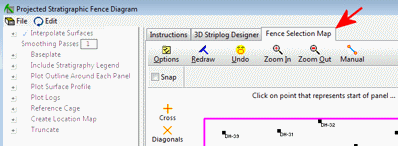
- Click on the Fence Selection Map tab that's displayed to the right of the options.
It will display the well locations in the Fence Diagram Configuration window as a plan-view map, with boring name and symbol color tied to each well. Any previous lines drawn for this project will also be displayed on the map. (Note: if you are using the Solid | Fence tool, only the project boundaries will be displayed.)
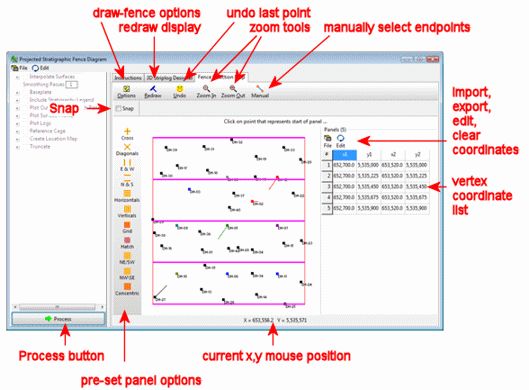
- To accept the existing fence panel arrangement, simply click the Process button at the bottom of the window to proceed with diagram generation.
- To clear the current display to start over, click the Clear button at the top of the window, or choose the Edit | Clear option in the data window.
- To draw a new fence panel or to add a new panel to the existing display, you have some options:
- First, to snap the panel endpoints to actual well locations, insert a check in the Snap check-box (above the map). After you select the panel endpoint pairs, they will be repositioned to the nearest boreholes.
- Lithology, modeled stratigraphy, I-Data, T-Data, P-Data, Fracture, Aquifer, and Color fence panels can lie between boreholes - the slices can be placed anywhere within the model.
- Straight stratigraphy fences must be drawn borehole to borehole, and the program will automatically snap panel endpoints to well locations.
- Manually draw the line: Simply left-click on the map location to become the one edge of the panel and then left-click on the location to become the other edge of the panel. The program will connect the points with a line.
Repeat the process for the next panel, which can be connected to this one, or not. Note that the program will display a prompt to "Click on panel starting-point" or "Click on panel end-point" to let you know where you're at. As you click to define the fence panel endpoints, the coordinates will be displayed in the table to the right.
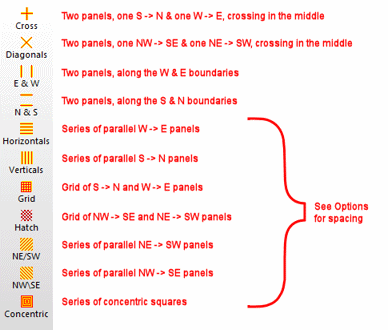
- Pre-configured panels: Another option for fence panels is to select a pre-configured panel arrangement by choosing an option from the menu displayed to the left of the selection map. For example, for an automatic X-shaped panel layout that extends to the edge of the model, click the Diagonals option. For equally spaced East-West panels, click the E & W option. You can select multiple arrangements.
The different panel layouts are shown below. As mentioned above, the slices do not need to conform to borehole locations for projected fence panels. They do for hole to hole fences (Stratigraphy menu) and the program will snap the drawn endpoints to the closest boreholes. See Options for information about the number of panels that will be created.
Importing/Exporting the Fence Panel Locations
- Imported endpoints: If you have a list of specific locations where you need the panels to be drawn, you can import these into the panel endpoint table to the right.
- Click on the File button at the top of the window and select Import.
- Project to Import from: Use this prompt to select the name of the project folder containing the XY pairs to be imported.
- Choose the data source:
- Choose Import from a Project if the XY pairs are stored in the selected project's database, and select the name of the table to be imported. (See XY Pair Tables for details.)
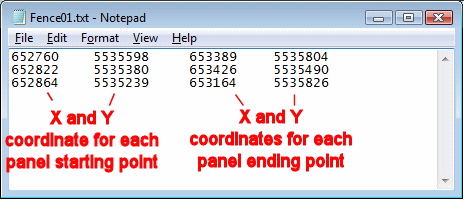
- Choose Import from a File if the XY pairs are stored in a text file (with a file name extension .tab or .txt) and select the name of the file to be imported. This must comply to this format:
- Once imported, you'll see the coordinates listed in the Panels table to the right of the map. You'll also see the represented fence panels in the display map.
- You can use any combination of hand-drawn, imported, and pre-configured panels that you wish.
- To export the current fence panel endpoints (for future use, for scripting, etc.):
- Click on the File button and select Export:
- Database File: choose this option to save the section trace coordinates to an XY Pair table in the project database. This can be used if you build scripts for creating fence diagrams in batch.
- Tab-Delimited ASCII File: Choose this option to save this fence panel endpoint coordinates to an ASCII tab-delimited file. An example is shown above.
- Click the Process button to accept the panel arrangement.
Notes:
- Mistakes? Click the Undo button (or Edit | Undo menu option) to remove the last-picked panel. You can use this command repeatedly to remove panels in backward order. Or, click the Clear button (Edit | Clear) to clear the display and start over.
- Fence diagram panels that extend beyond the current project dimensions will be truncated to the project boundaries. If you would like to be warned that this truncation has taken place, you can activate the Warn if Outside Project setting under the Options menu.
- See also: Options.

RockWare home page