
RockWorks | Borehole Manager | StripLogs | 3-Dimensional | Multiple Logs
Use this program to create a three-dimensional view of the strip logs of all enabled wells, displaying observed data entered into the borehole data tables. The logs can include any combination of the available log items. The borings can be vertical, inclined, or deviated. The completed image will be displayed in the RockPlot3D window.
Menu Options
Step-by-Step Instructions
Menu Options
- Group Title: Click to the right to enter a name for the 3D "group" or layer that will be displayed in the RockPlot3D window. (Default = "Logs")
- Clip : Insert a check in this box if you want to display a subset of the log data in the 3D diagram. You can clip the 3D logs along any axis.
- Expand this heading to define the X, Y and/or elevation range to be displayed. (More.)
- Reference Cage: Insert a check here to include vertical elevation axes and X and Y coordinate axes in the 3D diagram.
- Expand this item to set up the cage items. (More.)
- Legends:
- Include Lithology Legend: If you're including a lithology column in your logs, you can insert a check here to include a legend that lists all of the lithology keywords and their background colors, as listed in the project's Lithology Types Table. Expand this item to set the legend size, appearance, and other options. (More.)
- Include Stratigraphy Legend: If you're including a stratigraphy column in your logs, you can insert a check here to include a listing of the formation names along with their defined background colors, as listed in the project's Stratigraphy Types Table. Expand this item to establish the size, appearance, and other options. (More.)
- Include Well Construction Legend: If you're including a well construction column in your logs, you can insert a check here to include a listing of the well construction material names along with their defined background colors, as listed in the project's Well Construction Type Table. Expand this item to establish the size, appearance, and other options. (More.)
- Include Aquifer Legend: If you're including a water level column in your logs, you can insert a check here to include a legend that lists all of the aquifers in the project, as listed in the project's Aquifer Types Table. Expand this item to set the legend size, appearance, and other options. (More.)
- 3D Striplog Designer: Next, click on the 3D Striplog Designer tab to the right, to select the items to be displayed in the individual logs.
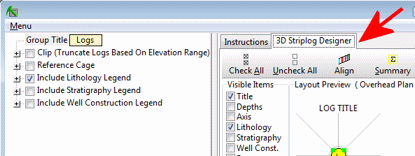
- Visible Items: Use the check-boxes in the Visible Items listing to select which log items are to be displayed. See Visible Item Summary for information about the different log items.
- Options: Click on any of the Visible Items names to see the item's settings in the Options pane to the right. See the Visible Item Summary for links to the Options settings.
- Layout Preview: For each item you've activated, you'll see it represented by a color- and letter-coded circle in the upper Layout Preview pane. Click and drag any item to rearrange the log columns, and click and drag on a column's handles to resize the column. See Using the 3D Log Designer.
Step-by-Step Summary
- Access the Borehole Manager program tab.
- Enter/import your data into the Borehole Manager database.
- In the list along the left side of the Borehole Manager window, enter a check-mark in the check-boxes of those boreholes you wish to include in the 3D log diagram. Only those boreholes you have so indicated as "enabled" will be included. (See the Filter or Select options for database query tools.)
- Select the Borehole Manager | StripLogs | 3-Dimensional | Multiple Logs menu option.
- Establish the menu options, described above.
- ! Be sure you click on the 3D Striplog Designer tab to lay out the logs (e.g. stratigraphy, curves, etc.)
- Click on the Process button at the bottom of the window to create the 3D log diagram.
The program will create a three-dimensional display of the active boreholes. Only the log items you have activated will be displayed in the logs, and other diagram options will be appended (legends, etc.). The logs will be displayed in a RockPlot3D tab in the Options window.
- You can adjust any of the diagram settings in the options to the left or on the 3D Striplog Designer tab, and click the Process button to regenerate the logs.
! Each time you click the Process button, the existing display will be replaced.
- View / save / manipulate / print / export the logs in the RockPlot3D window. (More.)
 Back to StripLogs Menu Summary

RockWare home page