
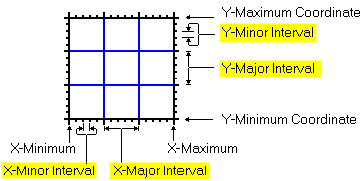
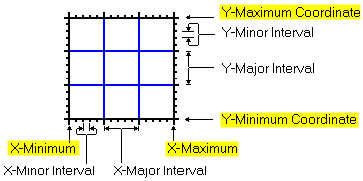
The Border layer is used to annotate the map or diagram with axis titles, axis lines and tick-marks, tick mark (coordinate) labels, and/or reference lines. Use the Border Options button, visible in all map menus under the Border heading, to access these settings.
! Note that these items can also be modified after the map is generated and displayed in RockPlot2D.
Menu Options
 Northern Axis Title,
 Northern Axis Title,  Eastern Axis Title,
 Eastern Axis Title,  Southern Axis Title,
 Southern Axis Title,  Western Axis Title: Use these check-marks in the graphic area to define which titles are to be included in the diagram.  Checked items will be displayed in the output map; unchecked items will not.  Note that you can define axis titles independently from plotting the axis lines themselves, below.  For example, you could specify a North/Top title of "CONTOUR MAP" with no axis lines selected to generate a simple title for the map.
 Western Axis Title: Use these check-marks in the graphic area to define which titles are to be included in the diagram.  Checked items will be displayed in the output map; unchecked items will not.  Note that you can define axis titles independently from plotting the axis lines themselves, below.  For example, you could specify a North/Top title of "CONTOUR MAP" with no axis lines selected to generate a simple title for the map. Plot Northern Axis,
 Plot Northern Axis,  Plot Eastern Axis,
 Plot Eastern Axis,  Plot Southern Axis,
 Plot Southern Axis,  Plot Western Axis: Use these check-marks in the graphic area to select which axis lines (with tick marks and labels) should be plotted.   How these axes are to look is defined in the Colors and Dimensions section, as discussed below.
 Plot Western Axis: Use these check-marks in the graphic area to select which axis lines (with tick marks and labels) should be plotted.   How these axes are to look is defined in the Colors and Dimensions section, as discussed below. Plot Horizontal Dividers,
 Plot Horizontal Dividers,  Plot Vertical Dividers: Use these check-marks in the graphic area to specify whether divider lines will be plotted through the middle of the map or diagram.  The appearance of these lines is set in the Colors and Dimensions section, described below.
 Plot Vertical Dividers: Use these check-marks in the graphic area to specify whether divider lines will be plotted through the middle of the map or diagram.  The appearance of these lines is set in the Colors and Dimensions section, described below. Plot Perimeter: Use this check-box in the graphic area to determine if a solid line perimeter should surround the map.
 Plot Perimeter: Use this check-box in the graphic area to determine if a solid line perimeter should surround the map.

Which to choose? Consider these points:
Dimensioning Method
Advantages
Disadvantages
Output Dimensions All maps will have the same border dimensions - useful when plotting different data sets that have different sample locations (e.g. surface geochemical sample sites based on outcrops versus drill hole locations). See Figure 1, below. Sample labels may extend beyond map borders. See Figure 2, below. Automatic Map borders are automatically set based on the extents of the data. Map borders will be automatically increased to include sample labels. See Figure 3, below. Different data sets will have different map dimensions. See Figure 4, below. Manual Map dimensions may be manually specified such that sample labels will be enclosed within map borders. Maps of different data sets will all be the same size. It's a hassle to manually specify the map dimensions. 
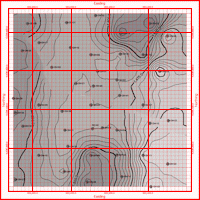
Figure 1: Different data sets, same map dimensions.
Figure 2. Sample labels extending beyond map borders.
Figure 3. Map borders based on output dimensions versus map borders based on data range.
Figure 4. The two maps along the top were plotted using the automatic border dimensioning. The two maps along the bottom were plotting using the output-dimensions border option. Note how the maps along the base show the locations of the magnetic and gravity surveys relative to each other whereas the maps along the top are very misleading
See also: 2D Map Options Overview