This program reads a grid model and creates a map which represents the number of grid nodes that are upgradient from each node.
Note: This program requires that a RockWorks surface model (.RwGrd file) model already exists.
Menu Options
Step-by-Step Summary
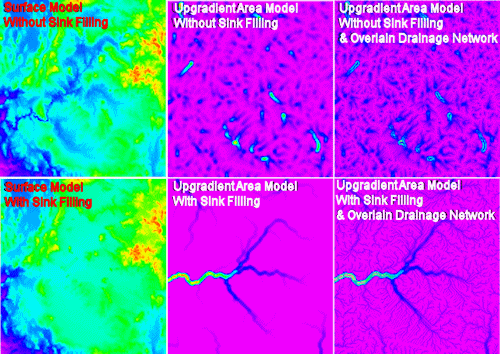
The program will read the input grid model, and create a polyline for each grid node that represent the downgradient path from that node to the lowest possible point. If the sinks (closed depressions) have not been filled (via the "Fill Sinks" option), these drainages may terminate within a sink hole. If the sinks have been filled, the drainages will typically end at the edges of the model.
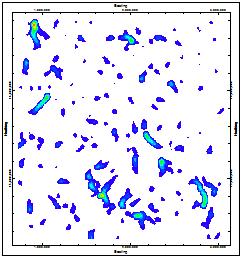
These polylines are then combined into a drainage network. The polylines within the drainage network include information about the number of nodes that have "drained" into each vertex within the network. By mapping this information into a grid, we are able to create a grid model whose nodes represent the number of grid nodes that are upgradient from each node. The output grid will be represented as a map and/or statistics report, as requested.
! The time required to fill the sinks with a grid model may range from seconds (for a 20x20 grid model) to hours (for a 250x250 grid model).
The requested diagram(s) will be displayed in a RockPlot2D tab in the Options window.
![]() Back to Grid Menu Summary
Back to Grid Menu Summary
![]()