Use the Striplog T-Data check-box(es) to plot downhole time-based interval data in the 3d log. Several display styles are offered. Up to 4 T-Data columns can be included in each log. The data is read from the T-Data table in the Borehole Manager database. When you click on the T-Data items in the layout window you’ll see the following settings in the pane to the right. The settings for each column can be established independently.
- Track: Click here to tell the program which track of values in the T-Data tables you wish to plot for the selected T-Data log column (#1, #2, #3, #4). When you click on this item, the program will display the current list of track names; click on a name to make a selection. Each T-Data column you activate can read from a different track, or read from the same track for different dates.
- G-Value Filter: Check this box to discard or replace high and/or low data values from the selected track for display in the logs. Subsequent automatic scaling of the T-Data columns will be based on the resulting G value range. (More info)
- Resample: Check this item to resample the data from the selected track for display in the logs. This is very useful when dealing with large datasets with closely sampled downhole data. (More info)
-
Note: To apply a spatial filter to the data to be represented in the logs, use the Spatial Filter button at the top of the previous window.
To apply a time filter for a specific date or range of dates, use the Time Filter button at the top of the previous window. (More info)
- Column Attributes
- Column title: Click here to enter text to be displayed above the column. If no title is desired, you can leave this field blank.
- Column Radius: The radius of the T-Data column is established as a percent of the output dimensions. As you click and drag to resize the column's green circle icon in the Layout Preview at the top of the window, this setting will be updated. If you edit the radius via this prompt, the size of the column in the Preview will be updated.
- Column Offset
- Direction: This reflects the position of the column, relative to the log axis (center), with 0 = north, 180 = south, and so on. As you click and drag the T-Data column's green circle icon in the Layout Preview pane (top), this value will be updated. Conversely, if you edit the azimuth direction in this prompt, the Preview will be updated.
- Distance: This represents the distance of the T-Data column center from the log axis (center), expressed as a percent of the output dimensions. As you reposition the column's green circle icon in the Layout Preview pane at the top of the screen, this value will be updated. And, as you edit the offset distance here, the Preview will be updated.
- Scaling: This controls how the range of data is plotted within the available column width. Click one of the available radio buttons:
- Automatic: RockWorks will scan the range of values in the specified Track for all of the active boreholes, for the selected date rang, thus determining the project’s minimum and maximum interval-data values sampled. It will then assign the inside of the T-Data column to the project’s minimum value and the outside of the column to the project’s maximum. Benefits: If you are plotting multiple boreholes, this assures that the data is plotted at the same scale in all logs.
- Manual: You can manually establish the interval-data value to correspond to the minimum and maximum edges of the T-Data column. Let’s say, for example, that your contaminant values in all wells ranged from .05 to .9, you might want to set the Minimum to 0 and the Maximum to 1. Use the Clip setting to cut off any bars that exceed the column maximum.
- Table Based: Choose this option if you want the bars to be scaled as defined in a table that you've created. This can be very valuable to highlight anomalies.
- Table name: Click here to select the name of the Bargraph Scale Table that you've created and saved in your project database.
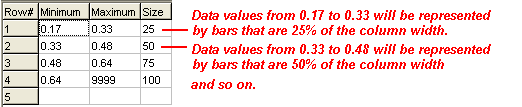
- ! Note that the plotting direction, established below, determines which edge of the column is assigned the minimum value and which is assigned the maximum.
- Uniform Radius (no scaling): Choose this for the T-Data values to be scaled the same, resulting in a smooth cylinder for the column. This assumes that you will use a color scheme, defined below, to distinguish the samples.
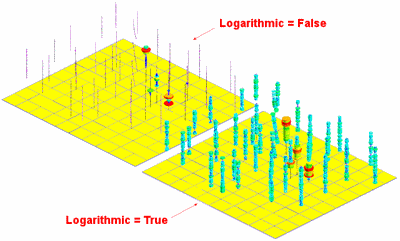
- Logarithmic: Insert a check here if you want to plot the natural logarithms of the T-data values.
The following 3D diagrams illustrate the usefulness of this new capability. In the upper-left diagram, the logarithmic option is disabled. Two of the logs contains some very high values. As a consequence, the variations within the low values in the other logs is virtually indistinguishable. The logs in the lower-right diagram are logarithmically scaled. Notice how the variability within the lower ranges become readily apparent. For example you can tell the difference between a low value and a missing sample (i.e. a black axis line).
- Appearance
- Plot Interval Labels: Check this to display a label for each measurement down the log. Be warned that hundreds of value labels can slow down the rendering of the log display in RockPlot3D. Use the Decimals prompt to specify the number of decimal places to display in the numeric labels.
- Color
- Choose Monochrome to fill with a solid color; expand this heading to select the fixed color.
- Choose Cold to Hot Colors to fill the bars with color that will vary based on the T-Data value at that point (low values in cold colors, high values in hot colors).
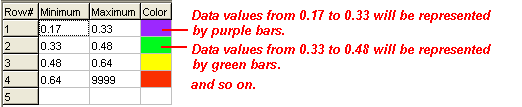
- Table Based: Choose this option to color the bars as defined in a table that you've created. This can be very valuable to highlight anomalies.
- Table name: Click here to select the name of the Color-Fill Table you've created and saved in the project database.
- Shape
- Tubes will look the most like "regular" bargraphs in 3D. Tube length is determined by the magnitude of the I-Data value. These can be plotted effectively with other strip log items (lithology, stratigraphy, etc.)
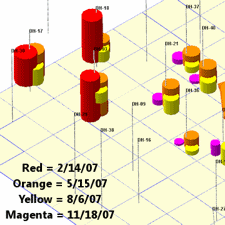
- Cylinders: Cylinder radius will be scaled based on the T-Data value magnitude, and the cylinder's height is determined by the sampling interval. They are centered on the T-Data column axis.
- Spheres: The radius of the spheres will be based on the T-Data value magnitude. Spheres are centered on the T-Data column axis.
- Oblates: This will display the T-Data values as an oblate ("squashed") sphere in 3D logs. The oblate's radius will be determined by the data value and the oblate's height by the sampling interval. Oblates are centered on the T-Data column axis.
- Miscellaneous Options for settings that establish the font size and offset for the column title and caption labels, activate horizontal and/or vertical divider lines, etc.
 Back to 3D Striplog Options

RockWare home page