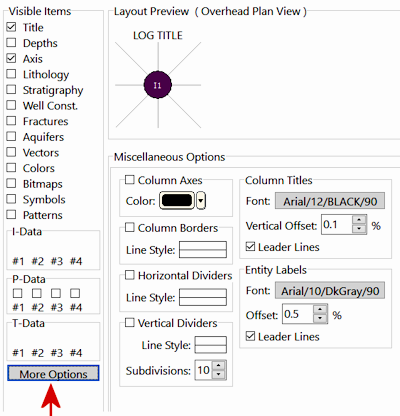
When you click on the More Options button in the RockWorks 3D Striplog Designer window, you'll see the following settings.
- Column Options
- Column Axes: Check this box to include a line representing the column axis, for each activated column within the 3D logs. Select the color. Note that this may be hidden within the column's cylinders, discs, etc.
- Column Borders: Check to include polyline borders around the image, P-Data, T-Data, and I-Data columns.
- Horizontal Dividers: Check this item to display horizontal lines down the log, at automatically-computed increments.
- Vertical Dividers: Check this to include vertical lines in all active I-Data, T-Data, and P-data columns.
- Subdivisions: Click to enter the number of divisions to display.
- Column Titles: Establish the font size, vertical offset, and leader lines for any column titles you've chosen to plot. The column title text is entered under the Options settings for each column.
- Font: Click here to select the font and size for the column title text.
- Offset: Enter here the offset of the title(s) above the log. Default = 0.1. If you know that you'll be displaying your logs at a significant vertical exaggeration, you might set this to 0.
- Leader Lines: Check to include a line between the column title and the top of the log.
- Entity Labels: Expand this heading to set font size, offset, and leader lines for any caption labels that you have activated, such as lithology keywords, water level dates, well construction captions, etc.
- Font: Click here to select the font and size for the label text.
- Offset: Enter here the offset of the labels to the side of the log column. Default = 0.5.
- Leader Lines: Check this box to include a line between the labels and the log column.
 Back to 3D Striplog Designer - Overview

RockWare home page