Exporting RockPlot2D Charts to Google Earth (KMZ) - Vertical
RockPlot2D File | Export | KMZ (Google Earth) Chart | Vertical
or
RockWorks | Graphics | 2D Tools | Export | KMZ | Vertical Chart -> Google Earth
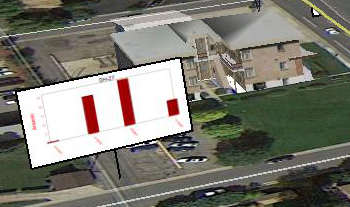
Use this program to save an existing chart diagram (saved as a RockPlot2D "Rw2D file") into a Google Earth KMZ file. The result is your RockWorks diagram plotted vertically in Google Earth, like a billboard. Examples include stereonet diagrams, rose diagrams, frequency histograms, etc.
! Since charts don't have any geo-referenced spatial information, you will need to define longitude and latitude coordinates for their placement.
Menu Options
Step-by-Step Summary
Tips
- Input File (Graphics menu only) Click this tab to browse for the name of the existing Rw2D file containing the chart diagram to be exported to KMZ format. This file must have already been saved in the RockPlot2D window. See Saving RockPlot2D Images.
- Location: Click this tab to define the location for the chart graphic.
- Longitude: Enter the decimal longitude coordinate for the center of the diagram. Be sure that western longitudes are entered as negative values.
- Latitude: Enter the decimal latitude coordinate for the center of the diagram. Be sure that southern latitudes are entered as negative values.
- Bearing: Enter the bearing for the chart, with "0" representing the top of the image toward the north.
- Dimensions (meters): Here you need to specify how wide and tall the diagram is to be, in meters, as displayed in Google Earth.
If it's important to keep the same aspect ratio as you see in RockPlot2D, you'll need to apply the same ratio to these values. For example, for a round rose diagram (without annotation), you will enter the same value for width and height. For a rectangular histogram diagram, you'll enter a width that is larger than the height.
- Width: Enter the left-to-right dimensions, in meters, for the chart as displayed in Google Earth.
- Height: Enter the bottom-to-top dimensions, in meters, for the chart as displayed in Google Earth.
- Group Name: Click this tab to type in the name for the group or heading in Google Earth. For example, "Rose Diagram" or "IData Histogram".
- Output Options: Click on this tab to define the output file and display settings.
- Output File Name
- Automatic: Choose this option to have RockWorks assign the name automatically. It will use the name of the current program plus a numeric suffix, plus the ".KMZ" file name extension.
- Manual: Click this option to type in your own file name. The extension is ".KMZ".
- Display output within Google Earth: Check this box if you want to display the output at this time in Google Earth.
! Note that the actual program which will be used to display the KMZ file is determined by your Windows settings.
- Use Custom View: If unchecked, the starting viewpoint for the diagram will be determined automatically. If checked you can set a custom view.
-
- Longitude, Latitude: Type in the longitude and latitude coordinates where the viewpoint will be.
- Heading: Type in the 0 to 360 degree bearing from the viewpoint to the vertical chart.
- Tilt: Type in the angle downward from the viewpoint to the chart.
- Range: Enter the distance in meters from the viewpoint to the chart.
- Figure out the coordinates for the chart diagram.
- From RockPlot2D: If necessary, open the Rw2D file containing the chart diagram you wish to export (see Opening Plot Files) or save the current plot if it is untitled (see Saving RockPlot2D Images).
- Select the File | Export | KMZ (Google Earth) Chart | Drape/Float option from the RockPlot2D menu.
- OR -
From the main RockWorks window, select the Graphics | 2D Tools | Export | KMZ | Vertical Chart -> Google Earth menu option.
- Enter the requested output settings, as described above.
- Click the Process button to proceed.
The program will create a KML file containing the graphic. It will create a KMZ (zip) file containing the KML file.
- If requested, RockWorks will launch your default KMZ viewing program (established in your Windows system) and load the output file.
- You can use use the Layers pane in RockPlot2D to turn on/off the items you do/don't want to have displayed in the output. Be sure to save the changes.
- You can also use the Crop tool to crop the portion of the image that you wish to export. Be sure to save the changes under the same name, or a new name.
- If you've deleted items from the chart for export purposes - say, removing a rose diagram legend - you can use the Rockplot2D View | Set Diagram Extents menu option to reset the extents of the picture.
 Back to Export menu
Back to Graphics Menu Summary

RockWare home page