RockWorks | ModOps | Grid | Statistics | Multivariate Anomalies
The purpose of this program is to provide an exploration tool when dealing with multiple spatial data sets. Given a list of grid models and weighting factors, the program performs creates a map/model that shows where all of the parameters are anomalous.
Note:
- All grids must have the same dimensions.
- If the weighting factor is omitted, program assumes that the weighting factor is 1.0.
- In order for this technique to work, sufficient non-anomalous data must be included (i.e. the project area must be large enough to generate sufficient background levels).
Menu Options
Step-by-Step Summary
- Data Columns
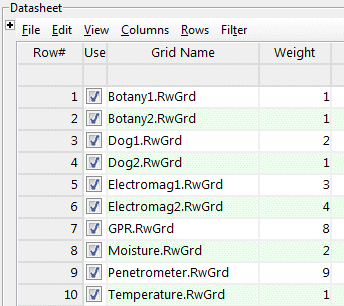
- Grid Name: Choose the column in the datasheet in which the names of the grid models to be analyzed are listed. The listed .RwGrd files must be saved in the current project folder.
- Weight: Select the datasheet column in which the weights for the grid models are listed.
- Output (Anomaly) Grid: Click here to enter a name for the final, output grid model to be saved. This file should have an .RwGrd file name extension.
- Filter: Insert a check here if you want to apply a value and/or area filter to the final grid. Click on this tab to enter the filter settings.
- Minimum Value: Enter the minimum standard deviation to be included in the final grid. For example, if the output anomaly grid values range from 0 to 4.75 and you are only interested in 2 standard deviations or higher, you could enter "2" here.
- Minimum Area: Enter the minimum area (representing square feet or meters per your project units) to be included in the final grid. This offers a means of excluding small anomalies from the final model.
- 2D Grid Map
Check this box to display the output grid as a 2D map at this time.
Click this tab to set up the 2D map layers (bitmap, symbols, labels, line contours, color-filled contours, labeled cells, map border, etc.).
- 3D Grid Diagram
Check this box to display the output grid as a 3D surface at this time.
Click this tab to set up the 3D map layers (surface colors, images, reference cage, etc.).
! You can request both a 2D and 3D representation of the grid model.
- Access the RockWorks Datasheet program tab.
- Create / open the data file that lists the grid model names and weighting factors (see example above).
- Select the Grid | Statistics | Multivariate Anomalies menu option.
- Enter the requested menu items, described above.
- Click the Process button to proceed.
The program will perform the following operations:
- For each grid:
- The mean and standard deviation for all grid nodes are computed.
- The node values are redefined in terms of standard deviations. For example, a node value of 1.7 means that the original node value is 1.7 standard deviations above the mean.
- All node values are then redefined to be in terms of absolute values. For example, a node value of -1.9 becomes 1.9.
- Each of the node values are then multiplied by the user-defined weighting factor.
- These standardized/filtered grids are then added together.
- The final grid (specified within the Multivariate Anomalies menu) is then subjected to the following process.
- The mean and standard deviation for all grid nodes are computed.
- The node values are redefined in terms of standard deviations.
- All node values are then redefined to be in terms of absolute values.
- All node values less than 1.0 are converted to zero.
- The requested diagram(s) will be displayed in a RockPlot2D tab and/or RockPlot3D tab in the Options window.
- You can adjust any of the settings in the Options window and then click the Process button again to regenerate the diagram(s).
- View / save / manipulate / export / print the diagram in the RockPlot2D or RockPlot3D window.
 Back to Grid Menu Summary

RockWare home page