RockWorks | ModOps | Grid | Directional | Slope Grid
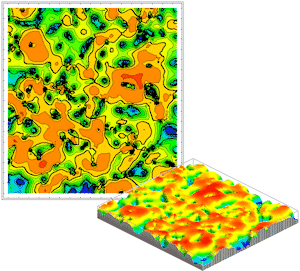
This program reads a grid (surface) model and computes the changes in Z-values (elevations, concentrations, etc.) between neighboring nodes. The resulting slope values are stored in a new grid model, with options for generating a 2D map and/or 3D surface.
Note: This program requires that a RockWorks surface (grid) model already exist.
Menu Options
Step-by-Step Summary
- Input Grid: Click to the right to browse for the name of the existing grid model to be analyzed and displayed as a slope map.
- Normalize Nodes Prior to Analysis: Leave this unchecked if your grid model represents topographic elevations.
If your grid model represents something other than topography (e.g. geochemical concentrations), you should check this box so that the Z values can be normalized to map units prior to computing the slope and aspect. For example, if a grid node spacing is 10 meters and the user is analyzing geochemical data than ranges between zero and 0.01, the maximum slope would be less than one degree in which case the program would produce a blank diagram. With normalization, however, the data is now rescaled to resemble a three-dimensional cube in which the slope will have a wide range (i.e. zero to 90 degrees).
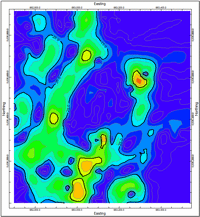
- Automatic: Using this normalization scheme, the program will rescale the grid node values such that the minimum node value will represent zero while the maximum node value will be equal to the map distance from the southwest corner to the northeast corner of the grid model. The map below illustrates a slope contour map based on normalized geochemical data that initially ranged between zero and 0.01.
-
- Manual: Choose this option if you want to enter your own min and max range within which the grid node values are to be normalized before the analysis is run.
- Output (Slope) Grid: Click to the right to type in the name to assign to the new grid model that will be created, with node-to-node slope computations recorded for the Z values.
- Slope Units: Select the desired units of the output slope grid file by clicking in the appropriate radio button.
- Degrees are useful for hydrology and structure.
- Percent is useful for civil engineering.
- Radians are useful for geometric analyses.
- 2D Grid Map
Check this box to display the output grid as a 2D map at this time.
Click this tab to set up the 2D map layers (bitmap, symbols, labels, line contours, color-filled contours, labeled cells, map border, etc.).
- 3D Grid Diagram
Check this box to display the output grid as a 3D surface at this time.
Click this tab to set up the 3D map layers (surface colors, images, reference cage, etc.).
! You can request both a 2D and 3D representation of the grid model.
- Be sure you have a RockWorks grid model already created, for input into this program.
- Select the ModOps | Grid | Directional | Slope Grid menu option.
- Enter the requested menu settings, described above.
- Click the Continue button to continue.
The program will read the input grid model, compute the slope and aspect for each node, storing the down-slope value for each node in the specified units in the output grid file.
The requested diagram(s) will be displayed in a RockPlot2D tab and/or RockPlot3D tab in the Options window.
- You can adjust any of the settings in the Options window (input grid model name, map settings, etc.) and then click the Process button again to regenerate the map.
- View / save / manipulate / export / print the map in the RockPlot2D or RockPlot3D window.
 Back to Grid Menu Summary

RockWare home page