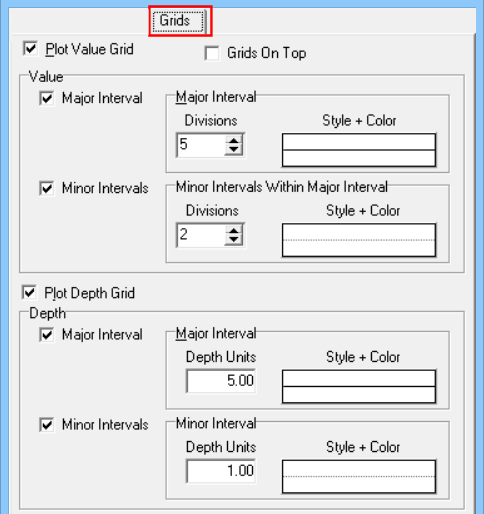
The Grids tab in the Curve, Bargraph, Cross-Plot Curve, and Tadpole column setup windows contains settings that control the plotting of horizontal and vertical grid lines to serve as value and depth reference markers.
! For Cross-Plot Curves, it’s important to note that the value and depth grids will be shared by both Curve 1 and Curve 2.
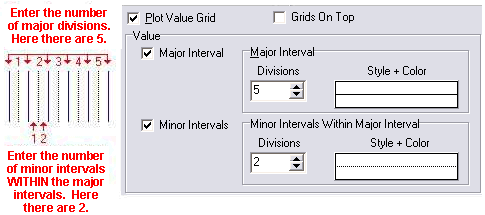
Linear Scaling If you have set up Linear scaling (Main tab), you can define both a major and a minor interval for the value grid lines:
Major Interval: Check this box to define the number of major groupings across the column. Click on the Style + Color sample to select a line style, thickness, and color for the major grid lines.
Minor Interval: Check this box to define the number of minor groupings WITHIN the major groupings. Click on the Style + Color sample to select a line style, thickness, and color for the minor grid lines.
Logarithmic Scaling: If you have requested Logarithmic scaling, then the program will determine automatically the number of grid lines to plot based on the log cycles that are represented by the minimum and maximum data values. You are, however, able to establish the major and minor grid line appearance.
Major Interval: Insert a check here to define a main depth or elevation interval, and click on the Style + Color box to select a line style, thickness and color for these lines. Enter the actual depth or elevation interval at which the lines should be drawn.
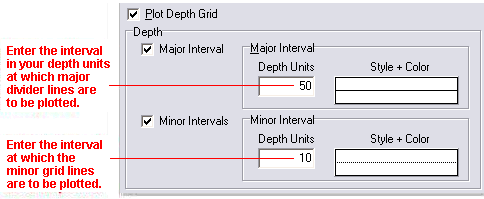
Minor Interval: Insert a check here to define a minor depth/elevation interval, and click on the Style + Color box to establish the line appearance. Enter the actual depth or elevation interval at which the lines should be drawn.
![]() Back to main topic (curves)
Back to main topic (curves)
![]() Back to main topic (bargraphs)
Back to main topic (bargraphs)
![]() Back to main topic (crossplot curves)
Back to main topic (crossplot curves)
![]() Back to main topic (tadpole columns)
Back to main topic (tadpole columns)
![]()