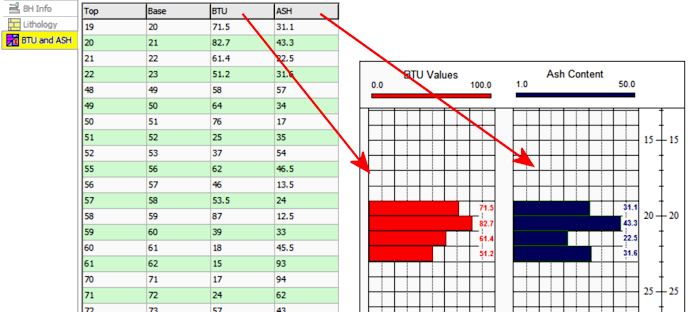
This example illustrates how Interval Data can be displayed on a log as bargraphs and bargraph value labels.
Introduction
Example
How to enter Interval Data
Use: The LogPlot Interval Data datasheet is used to list depth intervals and one or more columns of numeric data to be plotted as bars in a Bar Graph Column. The values can also plot as labels in Bar Graph Value columns, or as text in Interval Text columns.
An Interval Data datasheet can have a single column of values or multiple columns. You can have more than one Interval Data datasheet in a data file.
Alternative Datasheets:
For numeric data measured at depth points rather than depth intervals, see the Point Data datasheet.
For numeric data measured at depth intervals with date notations, see the Time Data datasheet.
For non-numeric data measured over depth intervals, see the Interval Text datasheet.Corresponding log design component: Numeric data listed in this datasheet will be plotted on the log as bar graphs in the Bar Graph columns. The data values themselves can be plotted as text labels in the Bar Graph Value Columns or in Interval Text columns.
Corresponding RockWorks data table: I-Data
Right-Click Options: When you right-click in any of the Interval Data cells, you have the following options:
Cut, Copy, Paste Insert/Append/Delete Rows Manipulate Columns Edit Data Page Name Add/Delete/Rename Columns Edit Columns and Groups Delete Data Page Move
This example illustrates how Interval Data can be displayed on a log as bargraphs and bargraph value labels.
Automatic:
If there are already Interval Data column(s) in the current log design to which you willl be linking the data, you can use the Data | Update Data File from Log Design menu option to insert one or more Interval Data datasheets in the current data file. The column names in the datasheet(s) will match the column names in the log design. The grouping of the columns in single/multiple datasheets will depend on the group assignments in the log design.
Manual:
You can also use the Data | New Data Page | Interval Data menu option to manually insert a new datasheet.
Group Name: Type in the name to assign to the datasheet's tab or group. If you leave this blank, it will default to the Name you enter, below.
New Name: Type in the name to assign to the first value column in the datasheet. Because Interval Data datasheets can have multiple columns, LogPlot uses the column names to match data to the items in the log design.
Click OK.
The program will add to the data file an Interval Data datasheet labeled with the selected Group Name and with three blank columns: Top and Base for depths, and a column with the Name you defined.
Top, Base: In these columns enter the depth at the top and base of the intervals at which the measurements were taken.
Shortcut: Right-click on any cell in the datasheet and select Fill Interval Column to fill the columns with regular depth increments.
Columns 3 +: These columns are where you can list the numeric data recorded at the listed depth intervals.
The Column Names
The names displayed as column headers within the Interval Data datasheet are used to match the data to particular Interval Data column in the log design. For example, the data in the "BTU" column will be plotted in the Interval Data column named "BTU" in the log's design.
Shortcut: Use the right-click options to add/rename/delete columns.
The Data Listing
To enter the actual data into the data page cells, you can use the <Tab> key to advance from cell to cell, and from the end of one row to the beginning of the next.
If there is no data for a depth interval, you may leave the interval blank.
Shortcut: If you already have this data in a tabular format in another application, you can copy the data there and then paste it into this datasheet using the Edit | Paste command.
![]() Back to LogPlot Datasheet Summary
Back to LogPlot Datasheet Summary
![]()