![]()
How it's Used
How to Insert a Curve/Bargraph Legend into a Log Design
Menu Settings
How to Reposition the Item
How to Review the Settings
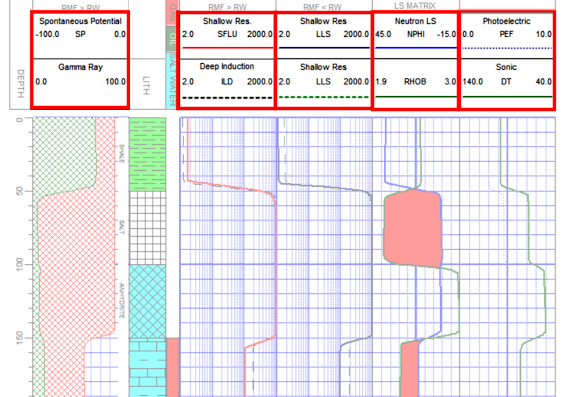
The Header/Footer Legend item is used to display column headings, value ranges and graphic samples for curve or bargraph columns. This is an automatic way to link header and footer text to quantitative columns in the log body for display of value ranges and line styles/colors.
This is a design item that links to Curve, Multi-Curve or Bargraph columns in the log design. It does not link to data fields.
Main tab:
Curve/Bargraph: Click on the down-arrow button to select the name of the Curve or Bargraph column in the current design to which this legend is to be linked. The legend must be linked to a Curve or Bargraph column in order to be able to poll the data ranges and display colors and styles.
Link Location: Check this box if the position of the legend is to be linked to the position of the column. If linked, if you move the Curve or Bargraph to the left or right in the body of the log, the Legend will move accordingly.
Position: These coordinates determine the placement of the edges of the legend block in the header or footer of the log. The X coordinate represents the horizontal (left to right) placement, and the Y coordinate the vertical placement in decimal inches or centimeters relative to the top of the header or footer. The defaults reflect the location where the block was drawn (step 4 above). You may change the legend placement by editing these values, or by moving/resizing the block itself on the design screen (often easier) or by linking the legend to the column (above).
Units (inches or centimeters) are declared under the File | Page Setup menu.Outline: Insert a check here to display a solid line border around the legend.
Fill: Insert a check here to fill the legend block with a color, and choose the color from the color box.
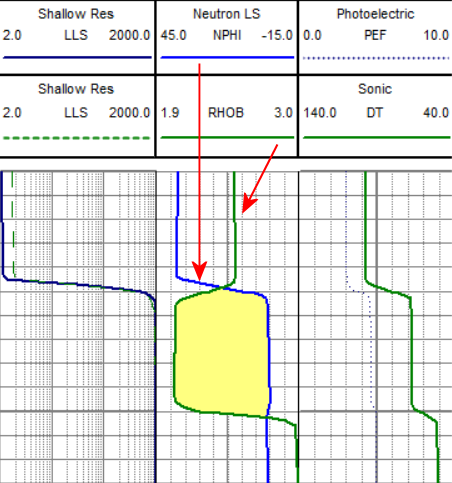
Plot Graphic: Insert a check here to display a sample of the curve line style and color, or the bar graph color in the legend, as shown below.
Titles tab:
Primary Title: This generally defaults to the name of the curve or bar graph selected on the Main tab. You can type in the desired text for the legend title. Click the Font button to choose a font type, style, and size. Use the Color button to choose the color for the text.
Secondary Title: This generally defaults blank. You can type in any text to appear as a label below the Primary title. Click the Font button to choose a font type, style, and size, and click the Color button to choose the text color.
Min/Max Titles: These will be placed below the main titles, and will represent the left- and right-edge values of the column to which this legend is linked. For example, if the legend is linked to a curve column set up with a minimum value of 0 along the left and a maximum value of 100 along the right, then the Min/Max Titles will print "0" along the left edge of the legend, and "100" along the right edge. Click the Font button to choose a font type, style, and size. Use the Color button to choose the color for the text. Use the Decimal Places setting to define the number of decimal places to display in the labels.
See: Move or Resize Header/Footer Items for information about dragging, resizing, and aligning items.
If you need to access the Setup window you can:
![]() Back to Header/Footer Item Summary
Back to Header/Footer Item Summary
![]()