Introduction
Example
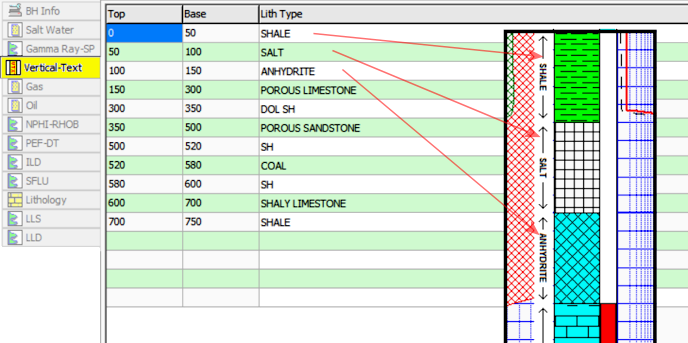
How to enter Vertical Text data
Use: The LogPlot Vertical Text datasheet is used to list depth intervals and one or more columns of alphanumeric data to be plotted vertically as text in a Vertical Text Column. This is often done in logs to note stratigraphic groupings or geologic time divisions, sample intervals, interval-based comments, and more.
A Vertical Text datasheet can have a single column of values or multiple columns. You can have more than one Vertical Text datasheet in a data file.
Alternative Datasheets:
For horizontal text to be plotted at depth points, use the Point Text datasheet.
For horizontal text to be plotted between depth intervals, use the Interval Text datasheet.Corresponding log design component: Text listed in this datasheet will be plotted on the log within the Vertical Text column of the same name.
Corresponding RockWorks data table: none
Right-Click Options: When you right-click in any of the Vertical-Text datasheet's cells, you have the following options:
Cut, Copy, Paste Insert/Append/Delete Rows Manipulate Columns Edit Data Page Name Add/Delete/Rename Columns Edit Columns and Groups Delete Data Page Move
Automatic:
If there are already Vertical Text column(s) in the current log design to which you willl be linking the data, you can use the Data | Update Data File from Log Design menu option to insert one or more Vertical Text datasheets in the current data file. The column names in the datasheet(s) will match the column names in the log design. The grouping of the columns in single/multiple datasheets will depend on the group assignments in the log design.
Manual:
You can also use the Data | New Data Page | Vertical Text menu option to manually insert a new datasheet.
Group Name: Type in the name to assign to the datasheet's tab or group. If you leave this blank, it will default to the Name you assign, below.
New Name: Type in the name to assign to the first text column in the datasheet. Because Vertical Text datasheets can have multiple columns, LogPlot uses the column names to match data to the items in the log design.
Click OK.
The program will add to the data file a Vertical Text datasheet labeled with the selected Group Name and with three blank columns: Top and Base for depths, and a column with the Name you defined.
Top, Base: In these columns enter the depth at the top and base of the intervals between which the text is to be plotted.
Shortcut: Right-click on any cell in the datasheet and select Fill Interval Column to fill the columns with regular depth increments.
Columns 3 +: These columns are where you can list the actual alphanumeric labels to be plotted between the listed depth intervals.
The Column Names
The names displayed as column headers within the Vertical Text datasheet are used to match the data to particular Vertical Text column in the log design. For example, the data in the "Stratigraphic Units" column will be plotted in the Vertical Text column named "Stratigraphic Units" in the log's design.
Shortcut: Use the right-click options to add/rename/delete columns.
The Data Listing
To enter the actual data into the data page cells, you can use the <Tab> key to advance from cell to cell, and from the end of one row to the beginning of the next. Enter the text to be plotted vertically within the indicated interval. The text can be short abbreviations or relatively lengthy, however if there is not enough room vertically to display the text, it will be truncated when the log is compiled; text will not wrap within the interval over multiple lines. Items that affect the interval length in addition to the depth range are font size (established in the Log Designer), and vertical plotting scale.
If there is no data for a depth interval, you may leave the interval blank. That text label will simply be omitted from the log.
Shortcut: If you already have this data in a tabular format in another application, you can copy the data there and then paste it into this datasheet using the Edit | Paste command.
![]() Back to LogPlot Datasheet Summary
Back to LogPlot Datasheet Summary
![]()