Model-based Sections: These are available within the RockWorks Borehole Manager's Lithology, Stratigraphy, I-Data, T-Data, P-Data, Fracture, Aquifers and Colors menus. They are used to display multiple, connected, vertical slices from the inside of a solid, stratigraphy, or aquifer model to illustrate lithology distribution, stratigraphic or water level elevations, geochemical/geophysical values, and fracture proximities. Striplogs can be included in any of these section diagrams.
Log-only Sections: These are available using the Striplogs | 2-Dimensional | Section program, and the Striplogs | Pick Stratigraphic Contacts and Striplogs | Pick Lithologic Intervals programs.
A Section tool is also available within the RockWorks | Utilities | Solid menu, to slice an existing solid model containing any type of data.
See Section Diagrams in the glossary for more details.
Selecting the Section Location
Importing/Exporting the Section Location
Notes
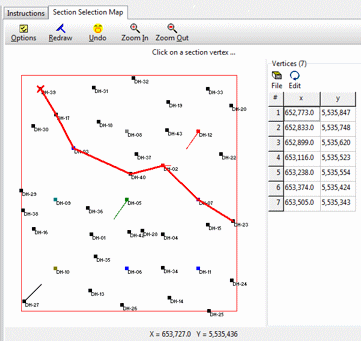
Selecting the Section Location
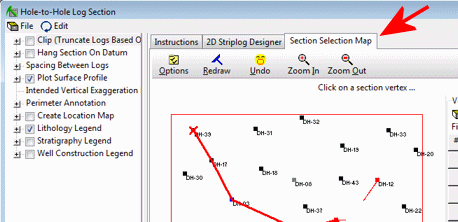
- Select the Section option from the Lithology, Stratigraphy, I-Data, T-Data, P-Data, Fractures, Aquifers or other menu.
- Establish the diagram-specific settings using the options which are listed in the left side of the program dialog.
- Click on the Section Selection Map tab that's displayed to the right of the options.
It will display the well locations as a plan-view map, with boring name and symbol color tied to each well. Any previous panels drawn for this project will also be displayed on the map.
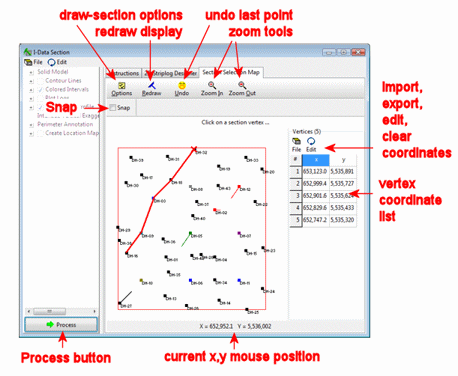
- To accept the current selection, simply click the Process button at the bottom of the window to proceed with diagram generation.
- To redraw the section line or to add onto the existing section line, follow these steps:
- To snap the panel endpoints to actual well locations, insert a check in the Snap check-box (above the map). After you select the panel endpoints, they will be repositioned to the nearest boreholes.
- Lithology, modeled stratigraphy, I-Data, T-Data, P-Data, Fracture, Aquifer and Color section panels can lie between boreholes - the slices can be placed anywhere within the model. However, if you choose to include striplogs in these section diagrams and if the panel endpoints don't lie at borehole locations, the program will simply project the closest log onto the panel.
- Straight stratigraphy sections and striplog sections must be drawn borehole to borehole, and the program will automatically snap panel endpoints to well locations.
- Reset the display (if necessary): Rockworks will remember any panel selections for this project from previous sessions. If you wish to discard any existing selections and start well-picking from scratch, click the Clear button at the top of the screen (also present in the Edit menu).
! DON'T do this if you want to append to an existing section.
- Pick the first panel endpoint / Append another panel: Click on the location to be represented along the left edge of the first panel of the section. If you are appending to an existing trace, pick the location for the next panel to be added to the existing list. The program will draw a line from the last endpoint to this one. The X and Y coordinates for this point will be posted to the vertex listing to the right.
- Pick the next endpoint, and the next and the next. Each selected panel point will be connected to the previous selection with a line, and its coordinates posted to the list.
Importing/Exporting the Section Location
- To import a list of section panel endpoints, follow these steps:
- Click on the File button at the top of the window and select Import.
- Project to import from: Click on the open-button to browse for the project folder which contains the XY Coordinate table or text file whose coordinates are to be imported.
- Choose whether you are importing from an XY Coordinate table in the project database, or from a text file.
- Import from a Project: Select the name of the XY Coordinate table you wish to use, from the Tables list to the right.
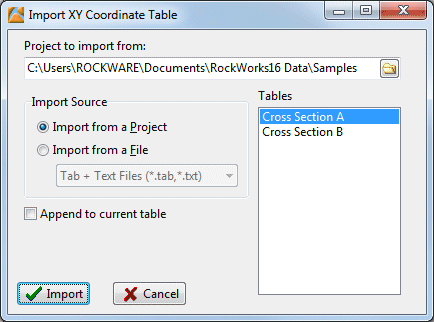
- Import from a File: Select the name of the TXT or TAB file that contains the listing of the panel vertices. This file must comply to this format:
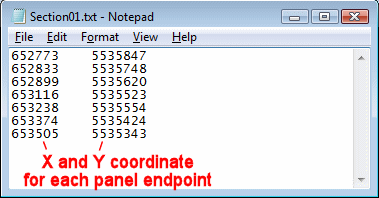
Columns must be separated by Tab characters. The file must be text in format, such as created by Windows notepad.
Once imported, you'll see the coordinates listed in the Vertices table to the right of the map. You'll also see the represented panels in the display map.
- To export the current section panel endpoints (for future use, for scripting, etc.):
- Click on the File button and select Export:
- Database File: choose this option to save the section trace coordinates to an XY Coordinates table in the project database. This can be used if you build scripts for creating cross sections in batch.
- Tab-Delimited ASCII File: Choose this option to save this section trace coordinates to an ASCII tab-delimited file. An example is shown above.
- Click the Process button to accept the section trace.
Notes:
- Well Order: In a section diagram, the order in which the panel endpoints are selected will make a big difference in the appearance of the diagram. The first panel you select, regardless of its position in the map, will be at the left edge of the cross section, and the last will be at the right edge.
- Mistakes? Click the Undo button to remove the last-picked point. You can use this command repeatedly to remove panels in backward order. Or, click the Clear button to clear the display and start over.
- To "zoom in" to a portion of the display:
- Click on the Zoom In button.
- Draw a rectangular area to be enlarged: Position the pointer on the map display where one corner of the enlarged area should be. Click and hold the left mouse button. Drag the mouse to the opposite corner of the area to be enlarged and release the mouse button. For your reference the enlargement rectangle will be displayed temporarily. When you release the mouse button, the program will magnify the selected map area.
- To "zoom out" of the display:
- Click on the Zoom Out button. The program will redraw the window to the original display, including all enabled boreholes.
- Section panels that extend beyond the current project dimensions will be truncated to the project boundaries. If you would like to be warned that this truncation has taken place, you can activate the Warn if Outside Project setting under the Options menu.
- See also: Options.

RockWare home page