Use the Striplog Vectors check-box to plot your downhole vector entries as oriented arrows in your 3D striplogs. The data is read from the Vectors table in the Borehole Manager database. When you click on the Vectors item in the Visible Items window you’ll see the following settings in the Options pane to the right.
- Column Attributes
- Column title: Click here to enter text to be displayed above the column. If no title is desired, you can leave this field blank.
- Column Radius: The radius of the Vectors column is established as a percent of the output dimensions. As you click and drag to resize a column in the Layout Preview at the top of the window, this setting will be updated. If you edit the radius via this prompt, the size of the column in the Preview will be updated. This setting will be ignored if you choose Variable dimensions, below.
- Column Offset
- Direction: This reflects the position of the column, relative to the log axis (center), with 0 = north, 180 = south, and so on. As you click and drag the Vectors column in the Layout Preview pane (top), this value will be updated. Conversely, if you edit the azimuth direction in this prompt, the Preview will be updated.
- Distance: This represents the distance of the axis of the Vectors column from the log axis (center), expressed as a percent of the output dimensions. As you reposition the column in the Layout Preview pane at the top of the screen, this value will be updated. And, as you edit the offset distance here, the Preview will be updated. In the example above, the Vectors column is positioned on top of the Lithology column, both with an Offset Distance of 0.
- Appearance
- Dimensions
- Tube Radius: Defines the radius of the tube portion of a vector arrow, expressed as a percentage of the project size.
- Cone Radius: Defines the radius of the cone tip that is plotted at the end of a vector arrow, expressed as a percentage of the project size.
- Cone Height: Defines the distance from the base of the cone tip to the end of the vector arrow, again expressed as a percentage of the project size.
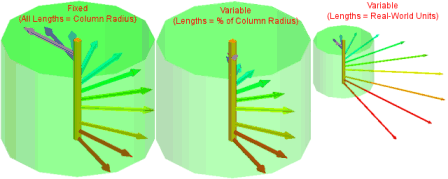
- Length:
- Uniform: All vectors will have the same length which will be equal to the vector column radius (above). In this setting, the vector "value" is ignored.
- Variable - % of Column Width: The vector "value" represents a percentage of the vector column radius. For example, a vector value of 50 will have a length equal to half of the vector column radius.
- Variable - Real World Units: The vector "value" represents a real vector length. For example, a value of 200 will plot a vector that whose length is 200 map units.
- Color:
- Fixed: All vectors will have the same color. Click on the color box to choose the color for all of the vectors.
- Variable: Vectors will have different colors based on either the Color column within the Vectors data group or the Magnitude of the vector.
- Automatic: This setting will establish colors automatically by scanning the range of Magnitudes and assigning low magnitudes a "cold" color (e.g. dark purple) and the high values a "hot" color (e.g. red).
- Manual (Column-Based): This option will assign colors based on the Color column within the Vectors datasheets.
- Behavior When Vertically Exaggerated: These settings determine the behavior of the vectors when the vertical exaggeration is adjusted within the RockPlot3D program.
- Vary Inclination: The inclination of the vectors will change based on the vertical exaggeration factor.
- Constant Inclination: The plunge of the vectors will stay the same, regardless of the vertical exaggeration.
 Back to 3D Striplog Options

RockWare home page