Use the Striplog P-Data check-box(es) to plot downhole point data in the 3d log. Several display styles are offered. Up to 4 P-Data columns can be included in each log. The data is read from the P-Data table in the Borehole Manager database. When you click on the P-Data items in the layout window you’ll see the following settings in the pane to the right. The settings for each column can be established independently.
- Track: Click here to select which track of values in the P-Data table to plot for the selected P-Data Column (#1, #2, #3, #4). Each P-Data column you activate can read from a different track.
- Column Attributes
- Column Title: Enter the text to be displayed above the column. If no title is desired, you can leave this field blank.
- Column Radius: The radius of the P-Data column is established as a percent of the output dimensions. As you click and drag to resize a column in the Layout Preview at the top of the window, this setting will be updated. If you edit the radius via this prompt, the size of the column in the Preview will be updated.
- Column Offset
- Direction: This reflects the position of the column, relative to the log axis (center), with 0 = north, 180 = south, and so on. As you click and drag the P-Data column in the Layout Preview pane (top), this value will be updated. Conversely, if you edit the azimuth direction in this prompt, the Preview will be updated.
- Distance: This represents the distance of the P-Data column center from the log axis (center), expressed as a percent of the output dimensions. As you reposition the column in the Layout Preview pane at the top of the screen, this value will be updated. And, as you edit the offset distance here, the Preview will be updated.
- Scaling: This controls how the range of point-data is plotted within the available column width.
- If you choose Automatic, RockWorks will scan the range of value in the specified Track for all of the active boreholes, thus determining the project’s minimum and maximum point-data values sampled. It will then assign the inside of the curve column to the project’s minimum value and the outside of the column to the project’s maximum. Benefits: If you are plotting multiple boreholes, this assures that the data is plotted at the same scale in all logs.
- If you choose Manual, you can establish the point-data value to correspond to the inner (minimum) and outer (maximum) edge of the curve column. Let’s say, for example, that your elog values in all wells ranged from 24 to 142, you might want to set the Minimum to 0 and the Maximum to 150.
- ! Note that the plotting direction, established below, determines which edge of the column is assigned the minimum value and which is assigned the maximum.
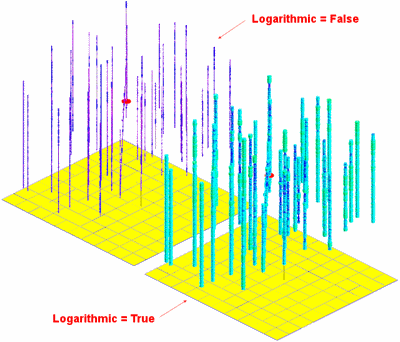
- Logarithmic: Check this to plot the natural logarithms of the P-data values.
The following 3D diagrams illustrate the usefulness of this capability. In the upper-left diagram, the logarithmic option is disabled. One of the logs contains a very high value. As a consequence, the variations within the low values in the other logs is virtually indistinguishable. The logs in the lower-right diagram are logarithmically scaled. Notice how the variability within the lower ranges become readily apparent. For example you can tell the difference between a low value and a missing sample (i.e. a black axis line).
- Appearance
- Curve: Check this item to display the P-Data as a curve in the 3D log.
- Line Style: Select the line style for the curve line.
- Curve Filling Options
- No Fill: Click this item to plot the curve line only.
- Monochrome: Click this item to fill the curve with the selected color.
- Disks: Check this to display point data as centered disks. Please refer to the sample image for the logarithmic logs, above, for an example of P-Data disks.
- Color:
- Monochrome: Choose this to display the disks in a single color; click the color box to select the disk color. Examples of monochrome (blue) disks are shown at the top of this page.
- Cold -> Hot Colors: Choose this option to display the disks on a cold-to-hot color scale from low to high values. Examples of variably-colored disks are also shown at the top of the page.
- Based on Lookup-Table: Choose this to assign disk colors based on a user-defined color table. Click to the right to select the name of the color table that contains the p-data value ranges and colors to be associated with them. This could be the same color table that you use to colorize a P-Data model.
- Constant Radius: Insert a check in this box to display the disks at a constant radius, overriding any scaling options. It's generally best to use this option with one of the two variable-color choices, above.
- Thickness:
- Automatic: Under this setting, the program scans the data to find the smallest interval and the disk is centered on its depth.
- Manual: Choose this if you wish to enter a specific value for the disk thickness, in your output elevation units.
! Selecting a thickness greater that the actual sample interval can cause data to be hidden.
- Miscellaneous Options for settings that establish the font size and offset for the column title, activate horizontal and/or vertical divider lines, etc.
 Back to 3D Striplog Options

RockWare home page