RockWorks | Borehole Operations | Production | Google Earth Billboards
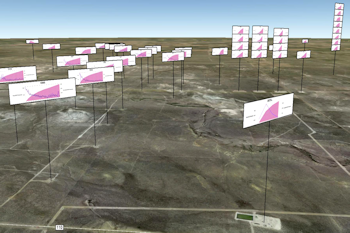
This program is used to read date-based oil and gas production data from the borehole database, create requested production graphs for each enabled well, and output the graphs as vertical "billboards" in Google Earth.
This program requires that Google Earth is installed on your computer. It is installed separately from RockWorks.
Feature Level: RockWorks Advanced
Menu Options
Step-by-Step Summary
- Graph Options
- Graph Type: Click on this tab to choose the type of graph(s) you wish to generate for the map.
- Type of graph: This drop-down list includes a long list of diagram types, for display of single measurements or multiple measurements, or a custom setup. (More info)
- Normalize graph(s) to same range as other wells: Check this box if the graphs for all of the wells are to be plotted at the same scale, to accomodate the highest value in the population.
- Plot Master Title: Check this box to include a title at the top of the graphs.
- Use Borehole Name: Choose this option to plot the borehole name as the graph title.
- Other: Choose this option to plot a different title. Enter the text for the title in the prompt.
- Font size: This is defined as a percent of the extent of the diagram. The greater the value, the larger the text. (Default = 3%)
- Custom Graphs: If you have set the Graph Type to Custom, you can define not only which graph(s) are to be plotted, but also define their specific settings.
- Custom Layout: Use these options to define which graphs are to be included in your composite diagram. (More info)
- Graph Options: Click this tab to access and edit the options for each graph type. (More info)
- Date Labeling Frequency: Choose the labeling frequency for the lower horizontal (time) axis for each graph.
- Date Filter: Check this box to restrict the graphs to a specific date range. Click this tab to define the range.
- Starting Date: Type in the starting date for the graphs using a mm/dd/yyyy or dd/mm/yyyy format as is consistent with how your data is displayed in the database (per Windows date/number format).
- Ending Date: Type in the ending date for the graphs using the same date format.
- Stratigraphy Filter: Check this box to plot the data listed for a specific formation. Click this tab to select the formation name. (If left unchecked, all measurements will be included, given the date filter, above).
- Filtering Formation: Select the name of the formation whose data is to be plotted. The formations will be listed from the Stratigraphy Types Table.
- Miscellaneous
- BOE Conversion Factor: Click to the right to type in the Barrel of Oil Equivalent conversion factor. Gas production values will be mulitplied by this value and added to the Oil production numbers to generate a total production value.
- Dimensions/Colors
- Diagram Dimensions: Use these settings to establish the size of each mini-graph on the map.
- Width: Here you can define the width of each graph as a percent of the map size. (Default = 5%)
- Height: This defines the height of each graph as a percent of the map size. (Default = 5%)
- Y-Offset: This defines how much below the well's location point the graph will plot. It is defined as a percent of the map size. (Default = 1%)
- Background
- Opacity: Use this to adjust the opacity of the production charts. At 100% they will plot using the solid color (defined below). At a lesser opacity any background graphics, such as contours if later appended, will show through.
- Color: Choose the background color for the graphs.
- Billboard Dimensions: Click here to view/adjust the Billboard settings.
- Units: Choose Feet or Meters by clicking in the appropriate radio button.
- Width: Type in the width, in the above units, for the billboards. For example, if you set the width to 50 meters, the billboards will plot that wide in relation to the ground in Google Earth.
- Elevation: Enter the offset above ground in the above units.
- Direction: Enter the left-to-right reading direction of the billboards, in a 0 to 360 azimuth format.
- Group clustered wells: Check this box if the billboards for proximal wells are to be combined into a single, stacked diagram.
- Group Name: Click this tab to type in the name to be displayed for the group in Google Earth.
- Output Options: Click on this tab to define the output file and display settings.
- Output File Name
- Automatic: Choose this option to have RockWorks assign the name automatically. It will use the name of the current program plus a numeric suffix, plus the ".KMZ" file name extension.
- Manual: Click this option to type in your own file name. The extension is ".KMZ".
- Display output within Google Earth: Check this box if you want to display the output at this time in Google Earth.
! Note that the actual program which will be used to display the KMZ file is determined by your Windows settings.
- Use Custom View: If unchecked, the starting viewpoint for the map will be determined automatically. If checked you can set a custom view.
-
- Longitude, Latitude: Type in the longitude and latitude coordinates where the viewpoint will be.
- Heading: Type in the 0 to 360 degree bearing from the viewpoint to the map.
- Tilt: Type in the angle downward from the viewpoint to the map.
- Range: Enter the distance in meters from the viewpoint to the map.
- Access the Borehole Manager program tab.
- Enter/import your well production data into the database.
- Select the Production | Google Earth Billboards menu option.
- Establish the program settings, discussed above.
- Click the Continue button to proceed.
The program will generate the requested graph(s) for the enabled boreholes, storing them in a KML file inside a KMZ (zip) file. The Google Earth KML and KMZ file names will be assigned automatically. The billboards will be displayed in Google Earth, if requested.
 Back to Production Menu Summary

RockWare home page