RockWorks | Borehole Operations | Production | Graph Map
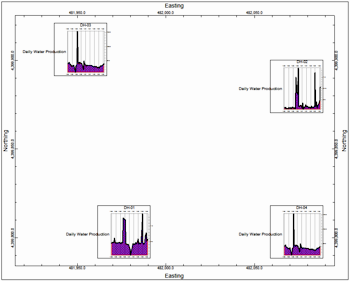
This program is used to read date-based oil and gas production data from the borehole database and create a map in which 2D production mini-graphs for all enabled wells are displayed. Many graph types are offered (oil production, gas production, etc.). The mini-graphs are plotted centered below the well's location.
Tip: Combine the production graphmap with a borehole location map to include the well symbols and other labels.
Feature Level: RockWorks Advanced
Menu Options
Step-by-Step Summary
- Graph Options
- Graph Type: Click on this tab to choose the type of diagram(s) you wish to generate for the map.
- Type of graph: This drop-down list includes a long list of diagram types, for display of single measurements or multiple measurements, or a custom setup. (More info)
- Normalize graph(s) to same range as other wells: Check this box if the graphs for all of the wells are to be plotted at the same scale, to accomodate the highest value in the population.
- Plot Master Title: Check this box to include a title at the top of the graphs.
- Use Borehole Name: Choose this option to plot the borehole name as the title of each graph.
- Other: Choose this option to plot a different title. Enter the text for the title in the prompt.
- Font size: This is defined as a percent of the extent of the diagram. The greater the value, the larger the text. (Default = 3%)
- Custom Graphs: If you have set the Graph Type to Custom, you can define not only which graph(s) are to be plotted, but also define their specific settings.
- Custom Layout: Use these options to define which graphs are to be included in your composite diagram. (More info)
- Graph Options: Click this tab to access and edit the options for each graph type. (More info)
- Date Labeling Frequency: Choose the labeling frequency for the lower horizontal (time) axis for each graph.
- Date Filter: Check this box to restrict the graphs to a specific date range. Click this tab to define the range.
- Starting Date: Type in the starting date for the graphs using a mm/dd/yyyy or dd/mm/yyyy format as is consistent with how your data is displayed in the database (per Windows date/number format).
- Ending Date: Type in the ending date for the graphs using the same date format.
- Stratigraphy Filter: Check this box to plot the data listed for a specific formation. Click this tab to select the formation name. (If left unchecked, all measurements will be included, given the date filter, above).
- Filtering Formation: Select the name of the formation whose data is to be plotted. The formations will be listed from the Stratigraphy Types Table.
- Miscellaneous
- BOE Conversion Factor: Click to the right to type in the Barrel of Oil Equivalent conversion factor. Gas production values will be mulitplied by this value and added to the Oil production numbers to generate a total production value.
- Dimensions/Colors
- Diagram Dimensions: Use these settings to establish the size of each mini-graph on the map.
- Width: Here you can define the width of each graph as a percent of the map size. (Default = 5%)
- Height: This defines the height of each graph as a percent of the map size. (Default = 5%)
- Y-Offset: This defines how much below the well's location point the graph will plot. It is defined as a percent of the map size. (Default = 1%)
- Background
- Opacity: Use this to adjust the opacity of the production charts. At 100% they will plot using the solid color (defined below). At a lesser opacity any background graphics, such as contours if later appended, will show through.
- Color: Choose the background color for the graphs.
- 2D Map Options
Use these checkboxes to append other layers to your map.
Click each tab to set up the 2D map layers (image, map peripherals, map border, etc.).
- Access the Borehole Manager program tab.
- Enter/import your well production data into the database.
- Select the Production | Graph Map menu option.
- Establish the program settings, discussed above.
- Click the Continue button to proceed.
The program will generate the requested graph(s) for the enabled boreholes. It will display a small graph on a map view at the well locations. If requested, the completed map will be displayed in a RockPlot2D tab in the Options window.
- You can adjust any of the diagram or map options in Options tab to the left and then click the Continue button again to regenerate the map.
- View / save / manipulate / print / export the map in the RockPlot2D window.
 Back to Production Menu Summary

RockWare home page