RockWorks | Borehole Manager | Production | Proportional Symbol Map
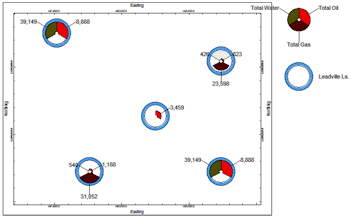
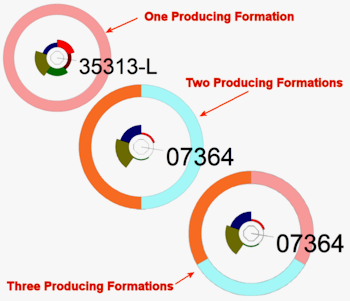
This program is used to read date-based oil and gas production data from the borehole database and create a map in which one or more components can be represented within scaled symbols at the well locations. The producing formation(s) can also be represented as rings around the proportionally-scaled symbols.
Feature Level: RockWorks Advanced
Menu Options
Step-by-Step Summary
- Symbols & Legend: Click on this tab to choose the data to be represented in the map symbols.
- Totals: To include total measurements for Oil, Gas, etc., insert a check in the item's check-box. Choose a color for the component using the color box to the right. You can choose one or many components for representation in the map.
- Maximums: To include maximum measurements for Oil, Gas, etc. in the symbols, insert a check in the item's check-box. Choose a color for each component to the right.
- Averages: Use these check-boxes to include average measurements in the symbols; use the color boxes to choose the representative color for each.
- Symbol Radius: These settings define the radius for the symbols for the smallest measurement in the population and for the largest. Intermediate measurements will be scaled proportionally between these. The size is defined as a percent of the project size; defaults = 0.5 to 2.0.
- Formation Donut: Insert a check here to have the producting formation(s) included as color-coded rings around the symbols for quick reference.
- Thickness: This defines the width of the ring, as a percent of the project size (default = 1.0).
- Perimeter: Check this to include a line perimeter around the ring. Click the line sample to choose the line style, thickness, and color.
-
- Labels: Check this option to include labels for each parameter in each symbol. Choose label contents with the items below.
- Font Size: Define the size for the label text as a percent of the project size (default = 1%).
- Name: Check this option to display the name of the component (e.g. "Max Oil/Day").
- Amount: Check this option to display the measured amount for that parameter.
- Radial: Check this option to display the label text radially - like spokes - from the center of the symbol. If left unchecked the label text will plot horizontally (default).
- Legend: Check this to include a legend to the components displayed in the symbols, their colors, and the formation donuts. Including this can be helpful to keep the map itself uncluttered.
- X-Offset: This defines how far to the right of the map the legend will be displayed, as a percent of the map area. (Default = 8%)
- Y-Offset: This defines how far below the top of the map the legend will plot, as a percent of the map area. (Default = 5%)
- Date Filter: Check this box to restrict the map data to a specific date range. Click the Options button to define the range.
- Starting Date: Type in the starting date for the map data using a mm/dd/yyyy or dd/mm/yyyy format as is consistent with how your data is displayed in the database (per Windows date/number format).
- Ending Date: Type in the ending date for the map data using the same date format.
- Stratigraphy Filter: Check this box to plot the data listed for a specific formation. Expand this heading to select the formation name. (If left unchecked, all measurements will be included, given the date filter, above).
- Filtering Formation: Select the name of the formation whose data is to be plotted. The formations listed are pulled from the Stratigraphy Types Table.
- Miscellaneous:
- BOE Conversion Factor: Click to the right to type in the Barrel of Oil Equivalent conversion factor. Gas production values will be mulitplied by this value and added to the Oil production numbers to generate a total production value.
- 2D Map Options
Use these checkboxes to append other layers to your map.
Click each tab to set up the 2D map layers (image, map peripherals, map border, etc.).
- Access the Borehole Manager program tab.
- Enter/import your well production data into the database.
- Select the Production | Proportional Symbol Map menu option.
- Establish the program settings, discussed above.
- Click the Continue button to proceed.
The program will generate symbols for the requested parameters for the enabled boreholes and plot them at the well locations on the map. If requested, the completed map will be displayed in a RockPlot2D tab in the Options window.
- You can adjust any of the symbol, label, or map options via the main Options tab to the left and then click the Continue button again to regenerate the map.
- View / save / manipulate / print / export the map in the RockPlot2D window.
 Back to Production Menu Summary

RockWare home page