
The Graph Type tab is used to select the type of graph to be plotted. This window is available from all of the Production menu options which create 2D (flat) graphs.
Menu Options
- Type of graph: This drop-down list includes a long list of diagram types.
- Single Data Types: The first grouping of diagram types will create a graph for a single type of data only; click on the type of diagram you want. Here are examples of the individual diagram types. Note that the diagrams plot with fixed plot settings. Choose Custom (described below) to customize the diagram and/or plotting parameters.
-
- Multiple Graphs: Choose from one of the standard overlay graphs. Note that the diagrams plot with fixed plot settings. Choose Custom (described below) to customize the diagram and/or plotting parameters.
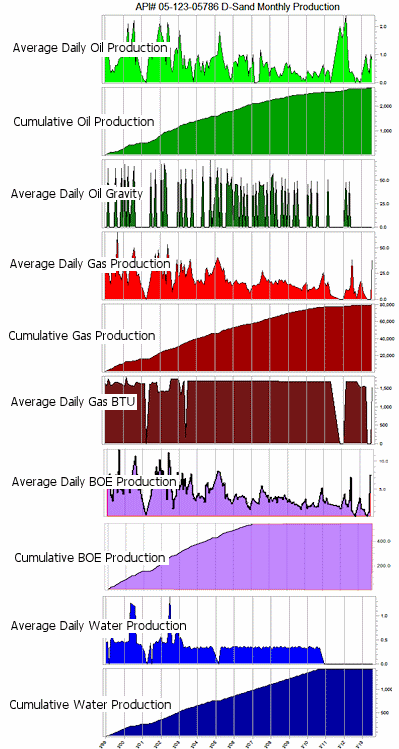
- All Parameters: Choose this option to create all of the above graphs in a single output plot.
- All Parameters - Optimized for size: Choose this option to create all of the above graphs in a single plot, but overlaying the Daily and Cumulative graphs for the related graph types, to save space.
- Average Daily Oil & Cumulative Oil: Displays cumulative oil in the background, with daily oil production points on top.
-
- Average Daily Gas & Cumulative Gas: Displays cumulative gas in the background, with daily gas production points on top.
- Average Daily BOE & Cumulative BOE: Displays cumulative Barrels of Oil Equivalent in the background, with daily BOE production points on top. Note that BOE is computed using the Conversion Factor defined in the main program window.
- Average Daily Water & Cumulative Water: Displays cumulative water in the background, with daily water production points on top.
- Average Daily Oil & Average Daily Gas: Displays daily oil and daily gas measurements with points and lines.
- Custom: Choose this option if you wish to customize your charts regarding the data that is displayed and/or the plotting parameters. You can use the Graph Options tab to view/adjust specific graph settings.

RockWare home page