RockWorks | Utilities | Linears | 3D Prismgram
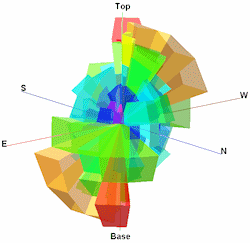
Use this program to read a range of azimuth bearings, a range of inclination angles, and measurement lengths, and display these measurements as oriented prisms in a 3D diagram. This can be used to display directional variability.
Menu Options
Step-by-Step Summary
- Data Columns: These tell RockWorks which columns in the current datasheet contain the input data.
Click on a displayed name to select a different name from the drop-down list.
- Color: Choose the column where the samples' colors are defined. If you choose Variable colors for the prism blocks, this column will be ignored; this data is not required.
- Min. Inclination: Select the column where the minimum inclinations are listed. These should be listed with 90 = straight up, 0 = horizontal, -90 = straight down.
- Max Inclination: Select the column containing the maximum inclination measurements. The min-max inclination range defines the vertical "bin" groupings.
- Min. Azimuth: Select the column where the minimum azimuth bearings (0-360) are listed.
- Max. Azimuth: Select the column where the maximum azimuth bearings are listed. The min-max bearing range defines the spatal bin groupings.
- Length: Select the column where the samples' lengths are listed. This can represent total counts of measurements (as a 3D rose diagram or a 3D variogram), actual fracture lengths, etc. This will be used to determine the length of the prisms; a multiplier can be defined, below.
- Style
- Length Multiplier: If you need to scale or convert the length measurements in the data file for display in the diagram, you can enter a value here. The Length entries in the data file will be multiplied by this value.
- Color:
- Defined by Color Column: Choose this if the colors are to be read from the column in the data file defined under the Data Column listing.
- Automatic (Based on Length): Click here if the colors are to be chosen automatically, on a cold to hot color scale based on the item length.
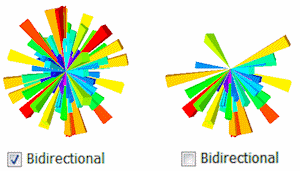
- Bidirectional: Check this box if the program should extend each prism 180 degrees opposite the listed measurement, representing bi-directional data.
-
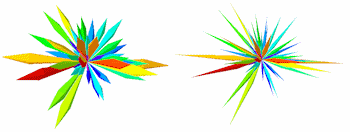
- Bevel Tops: Check this option to plot the prism tips with bevels rather than flat.
- Bevel Factor: This controls the angularity of the bevel; the lower the value the blunter the bevel. In this example, the left image is set to a factor of 1.5 and the one on the right is set to 3.0.
- Output Options
- Save Output File: Check this to assign a name for the 3D scene in advance, rather than displaying it as Untitled.
- Automatic: Choose this option to have RockWorks assign the name automatically. It will use the name of the current program plus a numeric suffix, plus the ".Rw3D" file name extension.
- Manual: Choose this option to type in a name of your own for this RockPlot3D file.
- Display Output: Check this option to have the resulting scene displayed in RockPlot3D once it is created.
- Access the RockWorks Datasheet program tab.
- Create a new datasheet and enter or import your listing of measurements: min and max 0-360 degree dip azimuth, min and max 90 (up) to -90 (down) dip angles, lengths, and (optional) colors.
Or, open one of the sample files and replace that data with your own. See Data Layout for datasheet examples.
! Click the Example button at the top of the window to load a sample file that is installed with the program.
- Select the Utilities | Linears | 3D Prismgram menu option.
- Enter the requested program settings, listed above.
- Click the Continue button to proceed.
The program will read the indicated measurements and create a 3D diagram that represents their directionality with prism blocks of the requested size and color. All blocks will start at an origin of 0. The completed diagram will be displayed in a RockPlot3D tab in the options window.
- You can adjust any of the diagram options and then click the Continue button again to regenerate the 3D image.
- View / manipulate the image in RockPlot3D.
 Back to Grafix Menu Summary

RockWare home page