RockWorks | Utilities | Earth | Lineations
This program:
- Reads a listing of data from the datasheet: Names and XY endpoint pairs (X1Y1, X2Y2)
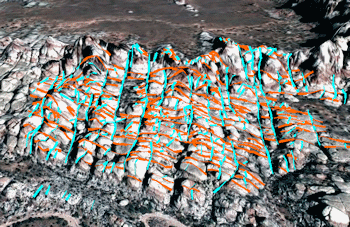
- Creates a KML output file with line segments drawn between these endpoints using fixed or variable colors and thicknesses, along the ground, relative to the ground, or at a fixed elevation.
- Creates a KMZ (zip) output file, containing the KML file.
- Loads the KMZ file in Google Earth.
Menu Options
Step-by-Step Summary
- Data Columns: These prompts tell RockWorks which columns in the current datasheet contain the input data.
Click on am existing name to select a different name from the drop-down list. See a sample data layout below.
- Name: Select the column that contains the text to label the lines in the Google Earth side panel.
- X1: Select the column that contains the X coordinates for the starting point for the lines.
These can be Eastings in meters or feet, decimal longitudes, etc. See Defining your Datasheet Coordinates for more information.
- Y1: Column that contains the Y coordinates for the starting point for the lines.
- X2: Column that contains the X coordinates for the line endpoints.
- Y1: Column that contains the Y coordinates for the line endpoints.
- Lines
- Line Color:
- Fixed: All lines will be plotted in the same color. Click the color box to choose the color.
- Variable (Defined by Column): Choose this option for the line colors to differ, based on color declarations listed in the datasheet. Select the name of the column in which the colors are listed.
- Line Thickness:
- Fixed: All lines will be plotted with the same thickness. Enter the thickness in pixels. (A setting of "1" creates thin lines, "3" thick lines.)
- Variable (Defined by Column): The lines can have different thicknesses, based on values listed in the datasheet. Select the name of the column where the thickness values are listed.
- Opacity: Click on the number to the right to choose how opaque the lines (and extruded panels, below) will be. "1" = fully transparent, "100" = fully opaque.
- Altitude: These settings determine the vertical placement of the lines.
- Clamped to Ground: Choose this for the line segments to lie along the ground topography. Note that long segments will be subdivided automatically to hug the ground.
- User-Specified
- Elevations
- Fixed: Choose this if all line endpoints are to be plotted at the same elevation. Click on the numeric value to the right to type in the desired elevation, in meters.
- Variable (Defined by Column): Choose this option if the elevations are listed in a column in the datasheet.
- Z1 Column: Select the column containing the elevations for the line starting points.
- Z2 Column: Select the column containing the elevations for the line endpoints.
- Elevation Mode:
- Relative to Ground: Choose this if the fixed or variable elevations (above) represent distances above the ground. Note that this offset is assigned to the line endpoints, so that short lines will mirror the topography but long lines will not.
- Absolute: Choose this if the fixed or variable elevations (above) represent absolute elevations, regardless of the elevation of the ground surface at that location.
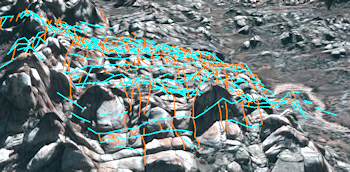
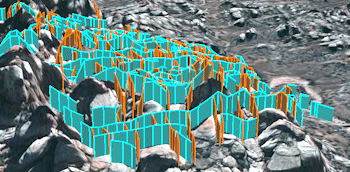
- Extrude: Check this option if you've selected above-ground display of the lines (Relative or Absolute, above) and want to display the lines as extruded panels coming up from ground level. See not-extruded to the left, below, and extruded to the right.
- Group Name: Type in the name to assign to the line map, which will be displayed in the Google Earth data tree.
- Output Options: Click on this tab to define the output file and display settings.
- Output File Name
- Automatic: Choose this option to have RockWorks assign the name automatically. It will use the name of the current program plus a numeric suffix, plus the ".KMZ" file name extension.
- Manual: Click this option to type in your own file name. The extension is ".KMZ".
- Display output within Google Earth: Check this box if you want to display the output at this time in Google Earth.
! Note that the actual program which will be used to display the KMZ file is determined by your Windows settings.
- Use Custom View: If unchecked, the starting viewpoint for the map will be determined automatically. If checked you can set a custom view.
- Longitude, Latitude: Type in the longitude and latitude coordinates where the viewpoint will be.
- Heading: Type in the 0 to 360 degree bearing from the viewpoint to the map.
- Tilt: Type in the angle downward from the viewpoint to the map.
- Range: Enter the distance in meters from the viewpoint to the map.
- Access the RockWorks Datasheet program tab.
- Create a new datasheet and enter or import your location coordinates and other information into the datasheet.
Or, open one of the sample files and replace that data with your own.
! Click the Example button to the left to load a sample file that is installed with the program.
Here is an example of how a data file might look.
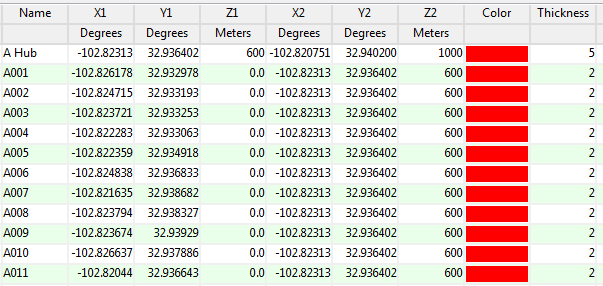
Longitude and latitude coordinates must be in decimal format. If you're using another coordinate system, be sure you've specified the Units and the Projection Settings as appropriate.
- Select the RockWorks | Utilities | Earth | Lineations menu option.
- Enter the menu options as described above.
- Click the Process button to continue.
The program will create a KML file with line segments between the coordinate pairs, in the color, thickness, and elevation mode you specified. It will create a KMZ (zip) file containing the KML file. The Google Earth KML and KMZ file names will be assigned as you specified.
The resulting map will be displayed in Google Earth, if requested.
 Back to Earth Menu Summary
"Google" is a trademark of Google Inc.

RockWare home page