RockWorks | Utilities | Earth | Cylinders
This program:
- Reads a listing of data from the Datasheet Editor: XY locations and (optionally) size declarations, measured values, colors, and label content.
- Creates a KML output file in which the point locations are represented illustrated with 3D cylinders, whose radius, height, and color are either fixed, defined in the datasheet, or scaled proportionally based on measurements in the datasheet.
- Creates a KMZ (zip) output file, containing the KML file.
- Loads the KMZ file in Google Earth, if requested.
Menu Options
Step-by-Step Summary
- Data Columns: These prompts tell RockWorks which columns in the current datasheet contain the required data.
Click on an existing name to select a different name from the drop-down list. See a sample data layout below.
- X (Easting): Select the column that contains the X coordinates for the points to be represented by cylinders.
These can be Eastings in meters or feet, decimal longitudes, etc. See Defining your Datasheet Coordinates for more information.
- Y (Northing): Select the column that contains the Y coordinates for the points.
- Cylinder Radius: Use these settings to establish the radius of the cylinders.
- Fixed: (Easiest) Click in this button if all of the cylinders are to have the same radius.
- Radius (Meters): Enter the radius for all of the cylinders, in meters.
For example, an entry of 1000 would create cylinders that have a radius of 1 kilometer.
- Variable: (Defined Within Data Column) Click in this button if the radius for each cylinder is listed in the datasheet.
- Radius Column: Select the column in the datasheet contains the radius listings and units.
- Proportional: (Scaled Relative to Data Column) Select this option to create cylinders with varying radii, scaled automatically based on a measured value in the datasheet.
- Data Column: Select the column in the datasheet contains the measurements to use for scaling the cylinders.
- Minimum Radius (Meters): Enter the radius for the cylinders, as expressed in meters, for the sample sites with the smallest value measurement (as read from the Data Column defined above).
For example, an entry of 1000 would create cylinders that have a radius of 1 kilometer for those sites with the minimum data value.
- Maximum Radius (Meters): Enter the radius for the cylinders, in meters, for the sample sites with the largest value measurement (as read from the Data Column defined above). Sites with intermediate Z values will be scaled proportionally between the minimum and maximum radii.
- Cylinder Height: Use these settings to establish the height of the cylinders.
- Fixed: (Easiest) Click in this button if all of the cylinders are to have the same height.
- Height (Meters): Defines the height for all of the cylinders, in meters.
For example, an entry of 10000 would create cylinders that have a height of 10 kilometers.
- Variable: (Defined Within Data Column) Click in this button if the height for each cylinder is listed in the datasheet.
- Height Column: Select the column in the datasheet contains the height listings and units.
- Proportional: (Scaled Relative to Column Data) Choose this option to create cylinders with varying heights, scaled automatically based on a measured value in the datasheet.
- Data Column: Select the column in the datasheet contains the measurements to use for scaling the cylinders.
- Minimum Height (Meters): Enter the height for the cylinders, as expressed in meters, for the sample sites with the smallest value measurement (as read from the Data Column defined above).
For example, an entry of 5000 would create cylinders that have a height of 5 kilometers.
- Maximum Height (Meters): Defines the height for the cylinders, in meters, for the sample sites with the largest value measurement (as read from the Data Column defined above). Sites with intermediate Z values will be scaled proportionally between the minimum and maximum heights.
- Cylinder Color: Use these settings to define the fill color for the cylinders.
- Fixed: (Easiest) Click in this button if all of the cylinders are to plot in the same color. Click the color box to choose the fill color.
- Variable: (Defined Within Data Column) Click in this button if the color for each cylinder is listed in the current datasheet.
- Color Column: Select the column in the datasheet contains the colors.
- Proportional: (Scaled Relative to Column Data) Click this button to create cylinders with varying colors, assigned automatically based on a measured value in the datasheet.
- Data Column: Select the column in the datasheet contains the measurements to use for coloring the cylinders. RockWorks will assign colors using a cold-to-hot scale (cold for low values, hot for high).
- Cylinder Opacity: Use this setting to define how opaque/transparent the cylinders will appear. A value of 100 will be fully opaque.
- Cylinder Labels: Insert a check here to label the sites in the Google Earth side panel and in the map.
- Column: Select the column that contains the text to be used for the labels.
- Color: Click on the color box to choose the color for the labels.
- Size: Enter the size of the labels. Default = 1.
Rule of thumb: 0.5 will create small labels, 2.0 large labels.
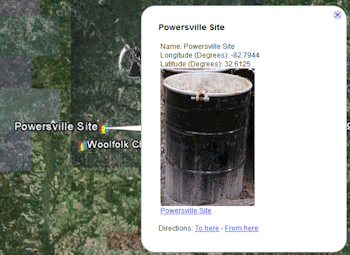
- Hyperlinks: Check this to include additional data with the cylinders in the output file, which can be displayed in Google Earth by clicking on a cone. Click on this tab to access the options and their data sources. In the example from Google Earth shown here, the extended description popup includes: the Label (first bold line), Descriptions (next three lines), an Image, and a Link (below the image).
- Descriptions: Check this to include extended descriptions. RockWorks pulls the description text from one or more columns in the datasheet. If you use multiple columns, they must be adjacent to each other.
- Start Column: Select the first column (left-most) in the current datasheet which contains the text for the extended descriptions.
- End Column: Select the last column (right-most) in the datasheet containing text for the descriptions. If you only have one column for description text, set the End Column to the same as the Start Column. All information from the start to the end columns will be included in the descriptions..
- Images: Check this if you want to include images in the description popups.
- Image Column: Select the name of the column in the current datasheet where the image names are listed.
- Links: Check this if you want to include a hyperlink in the description.
- Caption Column: Defines the column where the link text (what you actually click on in Google Earth) is listed.
- Link Column: Defines the column where the URL link content is listed.
- Group Name: Type in the name to assign to the cylinder map, which will be displayed in the Google Earth data tree.
- Output Options: Click on this tab to define the output file and display settings.
- Output File Name
- Automatic: Choose this option to have RockWorks assign the name automatically. It will use the name of the current program plus a numeric suffix, plus the ".KMZ" file name extension.
- Manual: Click this option to type in your own file name. The extension is ".KMZ".
- Display output within Google Earth: Check this box if you want to display the output at this time in Google Earth.
! Note that the actual program which will be used to display the KMZ file is determined by your Windows settings.
- Use Custom View: If unchecked, the starting viewpoint for the map will be determined automatically. If checked you can set a custom view.
- Longitude, Latitude: Type in the longitude and latitude coordinates where the viewpoint will be.
- Heading: Type in the 0 to 360 degree bearing from the viewpoint to the map.
- Tilt: Type in the angle downward from the viewpoint to the map.
- Range: Enter the distance in meters from the viewpoint to the map.
- Access the RockWorks Datasheet program tab.
- Create a new datasheet and enter or import your location coordinates, and any of the optional fields, into the datasheet.
Or, open one of the sample files and replace that data with your own.
! Click the Example button at the top of the window to load a sample file that is installed with the program.
Here is an example of how a data file might look. Note that only the X and Y columns (representing decimal Longitude and Latitude here) are required.
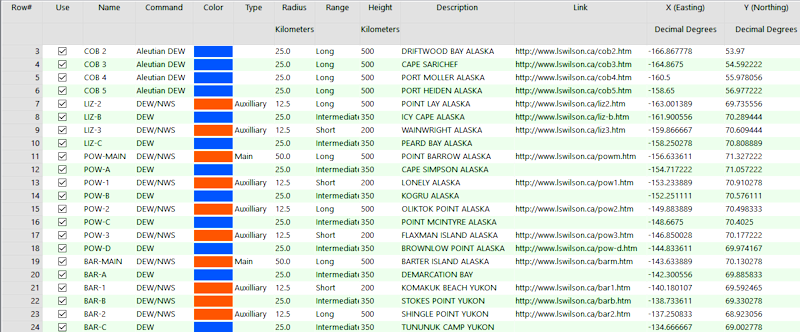
Longitude and latitude coordinates must be in decimal format. If you're using another coordinate system, be sure you've specified the Units and the Projection Settings as appropriate.
- Select the RockWorks | Utilities | Earth | Cylinders menu option.
- Enter the program settings as described above.
- Click the Continue button to proceed.
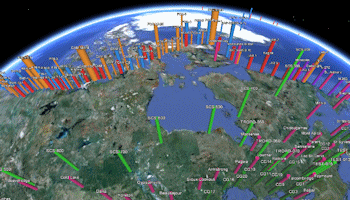
The program will create a KML file containing a map in which the point locations are represented with filled 3D cylinders, using the scaling, coloring, and labeling options you specify. It will create a KMZ (zip) file containing the KML file. The Google Earth KML and KMZ file names will be assigned as you specified.
The resulting map will be displayed in Google Earth, if requested.
 Back to Earth Menu Summary
"Google" is a trademark of Google Inc.

RockWare home page