"Multivariate" data can be entered into the RockWorks datasheet to list 2 or more components to be represented in a ternary diagram (Stats | Ternary), in a multi-variate map (Map | Bar Chart Map, Pie Chart Map, Spider Map, Starburst Map).
This example illustrates how you might set up a date file to list different soil components. This file could be used with the Stats | Ternary option to illustrate the components in a ternary diagram. It could also be used to display sand/shale/clay distribution in a pie-chart map.
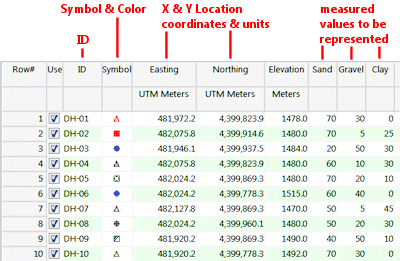
- ID: Optional. Used to label individual points in the diagram.
- Symbol: Required for ternary diagrams. Used to post the individual points in the ternary plot and to define their colors. Not used for multi-variate maps.
- X (Easting), Y (Northing) Coordinates: Required for multi-variate maps, not used for ternary diagrams.
These may represent a local coordinate system, or a global coordinate system such as UTM or longitude/latitude. See Defining your Datasheet Coordinates and Units for information.
- Z-Values: Required. You must least at least 2 columns (maps) or 3 columns (ternary plots) of Z-values. They may list any real number values (they do not have to represent percent as in this example). Blank cells will result in the row being skipped, so if a component is "0" be sure to enter "0" in its cell.
! RockWorks offers a variety of data layout suggestions, but you can organize your data columns any way you wish. During processing you can always specify which column contains what data.
- Stats_Ternary_1.rwDat, Stats_Ternary_2.rwDat, (etc.)
- Maps_Soil_Properties.rwDat

RockWare home page