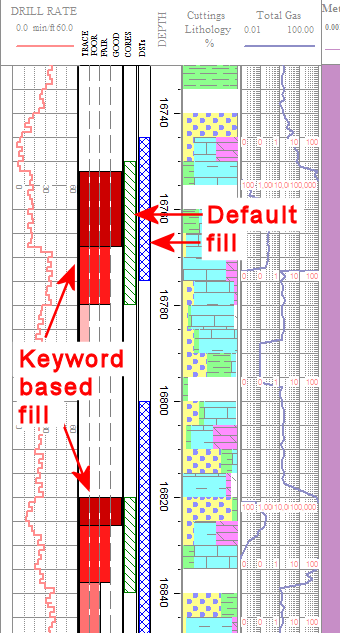
This excerpt illustrates three Fillbar columns: one with keyword-based fills (at varying widths), and two with default fills (appearance defined in the log design).
Introduction
Example
How to enter Fillbar Data
Use: The LogPlot Fillbar datasheet is used to enter depth intervals at which vertical pattern bars will be plotted on the log. These may represent sampling intervals, coring, or qualitative information ("poor show" or "trace"). The bars can be filled with a default pattern (defined in the log design) or with a keyword-specific pattern.
A Fillbar datasheet can have a single column of values or multiple columns. You can have more than one Fillbar datasheet in a data file.
Corresponding log design component: Data listed in this datasheet will be plotted on the log in the Fillbar Column of the same name.
Corresponding RockWorks data table: Pattern
Right-Click Options:
When you right-click in any of the Fillbar datasheet's cells, you have the following options:
Cut, Copy, Paste Insert/Append/Delete Rows Manipulate Columns Edit Data Page Name Add/Delete/Rename Columns Edit Columns and Groups Delete Data Page Move
This excerpt illustrates three Fillbar columns: one with keyword-based fills (at varying widths), and two with default fills (appearance defined in the log design).
Automatic:
If there is already a Fillbar column in the current log design to which you will be linking the data, you can use the Data | Update Data File from Log Design tool to insert one or more Fillbar datasheets in the current data file. The column names in the datasheet(s) will match the column names in the log design. The grouping of the columns in single/multiple datasheets will depend on the Group assignments in the log design.
Manual:
Select the Data | New Data Page | Fillbar menu option to manually insert a Fillbar datasheet.
Group Name: Type in the name to assign to the datasheet's tab or group. If you leave this blank, it will default to the name you enter below.
New Name: Type in the name to assign to the first value column in the datasheet. Because Fillbar datasheets can have multiple columns, LogPlot uses the column names to match data to the items in the log design.
Click OK.
The program will add to the data file a Fillbar datasheet with the selected name as the column heading.
Name: The names displayed as column headings are used to match the data to a particular Fillbar column in the log design. This name is declared when you first create the data page (above) and can be edited by right-clicking in the body of the data tab, and choosing the Edit Entity Name option from the pop-up menu.
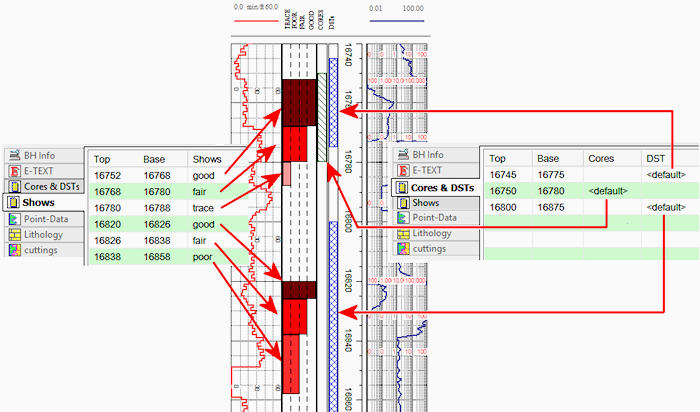
Top, Base: In these columns list the depth at the top and the base of the interval that is to be filled with a pattern. You may list multiple intervals for a single column.
Value: The actual value entered for the data field tells the program what pattern/color to use to fill the interval.
If you enter <default> for the interval, the Fillbar column will be filled with the default pattern defined in the log design. This is shown by the Cores and DST examples, above.
If you enter a keyword for the interval, the fillbar interval will be filled with the pattern that is associated with keyword. Like a Lithology datasheet, this field links to the current Keyword File. In this way, you can specify the pattern design, background and foreground colors, pattern density, and fill percent. In the Shows example above, the 4 different keywords were defined with different colors and different fill percentages ("trace" filling 25% of the column, "good" filling 100%).
Shortcut: Rather than typing in the keyword name, just double-click on the Fill cell to bring up the Lithology Selector window. Here you can pick from the available keywords in the current keyword file (and add new ones if necessary) and view the pattern that is associated with them.
![]() Back to LogPlot Datasheet Summary
Back to LogPlot Datasheet Summary
![]()