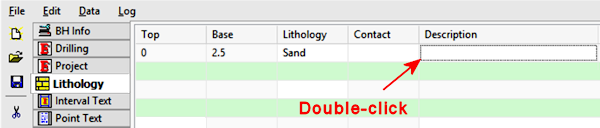
To open the editor, double-click in the "text" or "description" cell in the datasheet. Or, single-click in the "text" or "description" cell and click the small "..." button to the right.

Introduction
How to Open the Text Editor
How to Enter the Text
How to Format the Text
The LogPlot Text Editor window is used to type/paste in descriptive text. It is available in multiple datasheets:
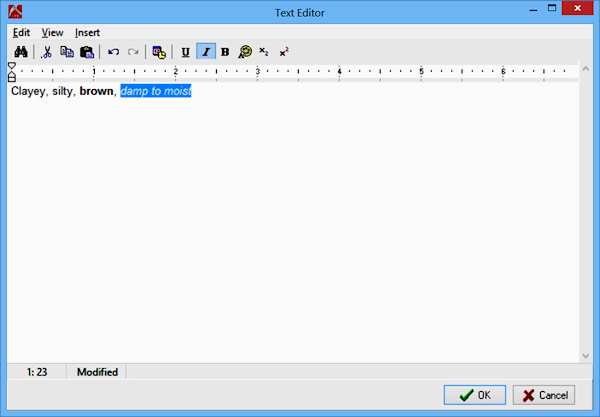
New: Apply text formatting - bold, italic, underline, color, superscript, subscript, or symbols - to selected words in your description text.
To open the editor, double-click in the "text" or "description" cell in the datasheet. Or, single-click in the "text" or "description" cell and click the small "..." button to the right.
To enter the text, you may type in from the keyboard, or use the following buttons:
Cut – Use this button to remove any highlighted text from the Editor window and place it in the computer's Clipboard for later pasting.
Copy – Use this button to place a copy of any highlighted text in the Editor window, and place it in the computer's Clipboard for later pasting.
Paste – Use this button to insert at the current cursor location in the Editor window the contents of the computer's Clipboard. Only text may be pasted into this window.
Text formatting: Select the word or words to which a style, color, and/or effect are to be applied, and click one of the buttons at the top to apply the selected formatting.
Notes:
When you save your data file, the text formatting will be saved using HTML tags:
Clayey, silty, <b>brown</b>, <i>damp to moist</i><br>IMPORTANT: The font type (Arial, Times, etc.) and the font size are defined in the log design - you cannot define type and size in the data file. The font style, color, and effects - bold, italic, color, etc. - can be defined in both the log design and in the data file. Any text WITHOUT style, color, or effect formatting in the data file will plot using the defaults established in the log design. Any text WITH style, color, or effect formatting in the data file will override the design defaults.
For example, let's say your Description column is set up with bold, blue text in the log design. A description with no formatting in the data file will plot in bold, blue text. A description saved with bold, red, italicized formatting will plot as such in the output log.
Paragraph formatting: You can format your descriptive text with paragraph breaks. In the Description Editor window, simply add carriage returns (paragraph markers using the <Enter> key) to format your text.
Notes:
When you save your data file, the paragraph breaks will be saved using "<br />" HTML tags.Because LogPlot stores the data files in an HTML format, if you need to insert additional spaces in the text, you'll need to do so using this HTML character entity:
![]() Back to Other LogPlot Data Tools
Back to Other LogPlot Data Tools
![]()