RockWorks | Utilities | Survey |
XYZ -> Optimum Path | Plot 3D Path
This program is used to compute the optimum (least curvature) path for a polyline (e.g. well bore, tunnel) that passes through a series of xyz points or intercepts. The input consists of a list of the XYZ intercept points. These intercepts might include seismic "hot spots" for a horizontal oil and gas well or vertical shaft locations that a planned tunnel must intersect.
Once the optimum path is computed, the program will create a 3D diagram displaying the intercept points, the computed path, and offset lines.
 Watch Video: http://youtu.be/kcq9HAqhcC4
See also:
- XYZ Points to get a detailed listing of XYZ points, downhole surveys, and distance from intercept points
- Downhole Survey to get a list of the depth/bearing/inclination survey values
Menu Options
Step-by-Step Summary
Menu Options
- Input Columns: The prompts along the left side of the window let RockWorks know which columns in the input datasheet contain the required data.
Click on an existing name to select a different name from the drop-down list. See a sample data layout below.
- Point X: Select the name of the column that contains the X-coordinates for the intercept points.
These can be Eastings in meters or feet, decimal longitudes, etc. See Defining your Datasheet Coordinates for more information.
- Point Y: Select the name of the column that contains the Y-coordinates for the intercept points.
- Point Z: Select the column that contains the Z (elevation) coordinates for the intercept points.
Be sure you've defined the elevation units in the datasheet.
- Curve-Fitting Parameters: Use these settings to define the angularity of the polyline.
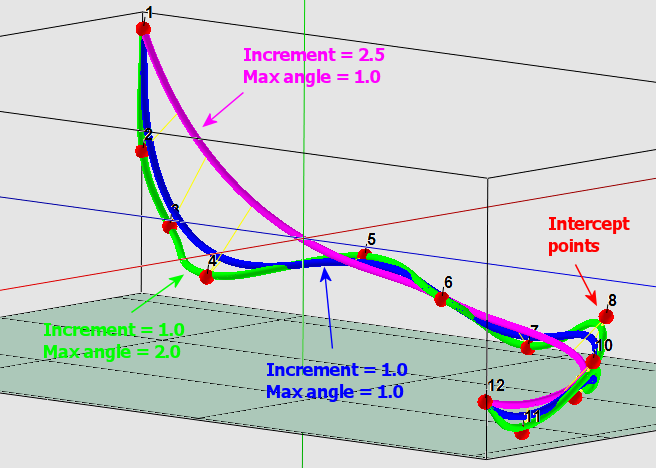
- Distance Increment: Click to the right to type in the depth or distance increment at which the polyline path is to be computed. For example, if your input XYZ points were sampled every 15 feet, then you can use that as a starting place. Bear in mind that the smaller the increment, the smoother the path.
- Maximum Angularity: Click to the right to type in the maximum angle change that is allowed for each segment. The correct amount to enter will depend on the distance increment and the nature of the drilling environment. See examples below.
- 3-D Diagram: Use these settings to define how the points and path will be displayed in 3D.
- Intercept Points (Spheres): The source XYZ points will be displayed in the 3D scene as colored spheres.
- Radius: Click to the right to type in the radius for the spheres, as a percent of the project size.
- Color: Click to the right to choose the color for the intercept spheres.
- Path (Tube): The computed polyline path will be displayed in the 3D scene as a tube.
- Radius: Click to the right to type in the radius for the 3D tube which will plot along the computed path.
- Color: Click to the right to choose a color for the tube.
- Intercept/Path Connectors (lines): Connecting lines will be drawn between the source intercept points and the computed tube.
- Thickness: Click to the right to type in the thickness for the lines. 1 = thin, 3 = thick
- Color: Click to the right to choose a color for the connector lines.
- Intercept Labels: The intercept spheres will be labeled with their sequential numbers.
- Font: Click the button to the right to select the font style, size, and color.
- Offset: Click to the right to enter the offset of the labels from the spheres, as a percent of the project size, in the X, Y, and Z directions. You can enter either positive or negative values
- Include Leader Lines: Check this box to include small lines between the labels and the spheres.
Step-by-Step Summary
- Access the RockWorks Utilities program tab.
- Create a new datasheet and enter or import your XYZ intercept points.
Or, open one of the sample files and replace that data with your own. (In this example, the sample file = "RockWorks17 Data\Samples\XYZ_to_Path_01.rwDat")

Longitude and latitude coordinates must be in decimal format. If you're using another coordinate system, be sure you've specified the Units and the Projection Settings as appropriate.
- Select the Survey | XYZ -> Optimum Path | Plot 3D Path menu option.
- Enter the requested menu settings, described above.
- Click the Process button to continue.
The program will compute the path between points at the requested distance increment and maximum angle. It will then generate a 3D display of the intercept points, pathway tube, and labels. The diagram will be displayed in a RockPlot3D tab in the Options window.
- You can adjust any of the options along the left and click the Process button to regenerate the display.
! Each time you click the Process button, the existing display will be replaced.
- View / save / manipulate / print / export the image in the RockPlot3D window.
Here are some examples of the effect of the distance increment and maximum anglularity on the computed path. These examples were generated using the sample data file "XYZ_to_Path_01.rwDat".
 Back to Survey Menu Summary

RockWare home page