
RockWorks | Utilities | Survey |
Lateral 3D GeoSteering Comparison
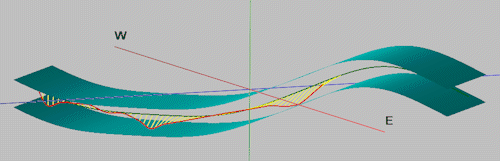
This program reads planned and actual downhole survey data from two designated ".RwDat" datasheets and produces a 3D diagram showing the relationship between the two paths.
See also: 2D Geosteering Diagrams
Menu Options
Step-by-Step Summary
Menu Options
- Starting Location: Expand this heading to enter the starting coordinates for the wellbore. Note that this should represent the location from which the survey data (defined above) originate. If you want to clip the view of the hole, you can do that using the Depth Filter settings, below.
- X (Easting): Click to the right to type in the X or Easting coordinate for the start of the hole.
- Y (Northing): Click to type in the Y or Northing coordinate for the start of the hole.
- Z (Elevation): Click to type in the Z or elevation coordinate for the start of the hole.
- Planned Survey Table: Click to the right to browse for the name of the datasheet (.RwDat file) that contains the depth, azimuth, and inclination measurements for the planned well path. See below for required input format and example files.
- Planned Total Depth: Click to the right to type in the planned total depth for the hole. This represents measured depth, along the wellbore.
- Actual Survey Table: Click to the right to browse for the name of the datasheet that contains the depth, azimuth, and inclination measurements for the actual well.
- Current Depth: Click to type in the current measured depth along the hole.
- Diagram Settings: Expand this heading to access the settings for the different portions of the 3D scene.
- Depth Filter: Insert a check here if you wish to display a subset of the entire wellbore. Expand this heading to define the minimum and maximum depths.
- Minimum: Click to the right to enter the top depth for the 3D diagram. This represents measured depth along the wellbore.
- Maximum: Click to type in the base depth to be reprented in the diagram.
- Planned Wellpath: Insert a check in this box if you wish to plot a 3D tube representing the planned wellpath. Expand this heading to access the plotting options.
- Color: Click to the right to choose a color for the tube.
- Radius: Click to the right to type in the radius for the 3D tube which will plot along the planned path. This is defined in your project units.
- Actual Wellpath: Insert a check here to plot a 3D tube representing the actual wellpath.
- Color: Click to the right to choose a color for the tube.
- Radius: Click to the right to type in the radius for the 3D tube which will plot along the actual path. This represents your project units.
- Depth Connectors: Check this box to include lines which will connect the two paths at specified depth increments.
- Depth Interval: Click to the right to type in the depth increments at which the connectors are to be drawn between the tubes.
- Color: Click to the right to choose a color for the connector lines.
- Thickness: Click to the right to define the line thickness. 1 = thin lines, 3 = thick.
- Payzone: Check this option to include two surfaces in the 3D display, above and below the planned wellpath. Expand this heading to access the options.
- Top Color: Click to the right to choose a color for the upper payzone surface.
- Distance to Top: Click to the right to type in the distance, in your project units, above the planned survey path, for the upper payzone band.
- Base Color: Click to the right to choose a color for the lower payzone surface.
- Distance to Base: Click to type in the distance below the planned survey path for the lower payzone band.
- Width: Use this setting to define how wide the payzone "ribbons" will be in the 3D view. This is defined in your project units. For example, if you enter "50" then the payzone surfaces will be 50 feet or meters wide in the 3D display.
- Segment Length: Click here to type in the distance units, in your project coordinates, at which the surfaces will be interpolated.
- Reference Cage: Insert a check here to include vertical elevation axes and X and Y coordinate axes in the 3D diagram.
- Expand this item to set up the cage items. (More.)
! Note: If you are displaying only the horizontal portion of the wellbore, the vertical extents of the diagram will be relatively small. If you want to include the axis annotations, we recommend that you use the Cage Options to set the Dimensions of the cage to Automatic scaling - to fit the diagram itself - rather than using the Output Dimensions which will extend around the entirety of the project.
Step-by-Step Summary
- Access the RockWorks Utilities program tab.
- Create a new datasheet and enter or import the required input data.
Or, open the sample files and replace that data with your own. In the following example, the sample files are:
- Planned Survey: "RockWorks17 Data\Samples\GeoSteer_Planned_Survey_01.rwDat"
- Actual Survey: "RockWorks17 Data\Samples\GeoSteer_Actual_Survey_01.rwDat"

Be sure you've specified the units for the depths in the datasheets.
- Select the Survey | Lateral 3D GeoSteering Comparison menu option.
- Enter the requested menu items, described above.
- Click the Process button to continue.
The program will read the Planned Survey and Actual Survey data and generate the polyline path tubes as requested. Payzone surfaces, depth connectors, and the reference cage will be appended if activated. The completed diagram will be displayed in a RockPlot3D tab in the Options window.
- You can adjust any of the options along the left and click the Process button to regenerate the display.
! Each time you click the Process button, the existing display will be replaced.
- View / save / manipulate / print / export the scene in the RockPlot3D window.
Tip: If your image looks really flat, use the View | Dimensions menu to change the Vertical Exaggeration setting to something > 1. Some diagrams may need to be stretched by a factor of 25 or 50 to see the detail in the horizontal well.
 Back to Survey Menu Summary

RockWare home page