
RockWorks | Utilities | Survey | Lateral GeoSteering Diagram
This program reads planned downhole survey data, actual downhole survey data, gamma, resistivity, and gas data from four designated ".RwDat" datasheets and produces a profile diagram showing a depth versus elevation plot showing the difference between the planned and the actual survey.
See also: 3D Geosteering Diagrams
Menu Options
Step-by-Step Summary
Menu Options
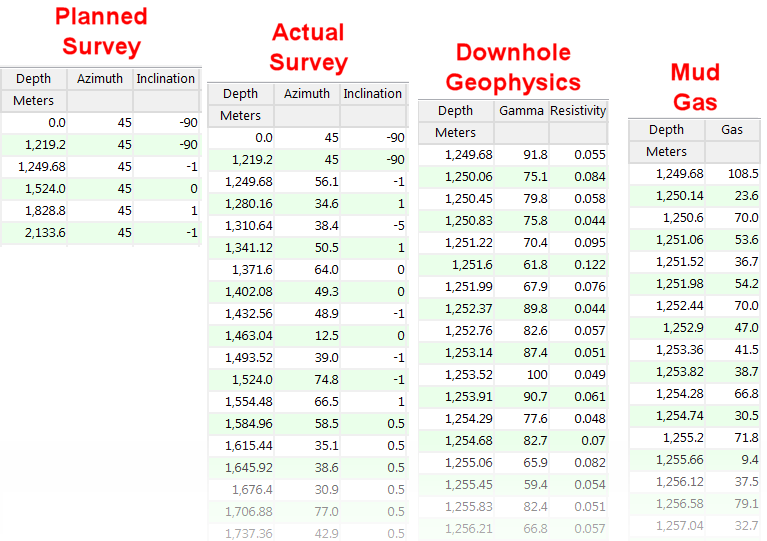
- Input Tables (Datasheets): This program reads information from 4 separate datasheets. These prompts are used to define the input file names. See below for required input format and example files.
- Planned Survey: Click to the right to browse for the name of the datasheet (.RwDat file) that contains the depth, azimuth, and inclination measurements for the planned well path.
- Actual Survey: Click to the right to browse for the name of the datasheet that contains the depth, azimuth, and inclination measurements for the actual well.
- Downhole Geophysics: Click to the right to browse for the name of the datasheet that contains the downhole depths and Gamma and Resistivity measurements.
- Mud Gas: Click to the right to browse for the name of the datasheet that contains the downhole depths and gas measurements.
- Report Title: Click to the right to type in the text to be displayed as the title at the top of the diagram.
- Starting Location: Expand this heading to enter the starting coordinates for the wellbore. Note that this should represent the location from which the survey data (defined above) originate.
- X (Easting): Click to the right to type in the X or Easting coordinate for the start of the hole.
- Y (Northing): Click to type in the Y or Northing coordinate for the start of the hole.
- Z (Elevation): Click to type in the Z or elevation coordinate for the start of the hole.
- Planned Total Depth: Click to the right to type in the planned total depth for the hole. This represents measured depth, along the well bore.
- Current Depth: Click to type in the current measured depth along the hole.
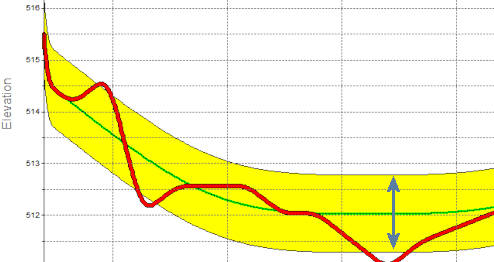
- Payzone (Relative to Axis): This represents the colored band, shown in yellow in the example below, that encloses the Planned Survey path (green line).
- Top: Click to the right to type in the distance, in your project units, above the planned survey path, for the top of the payzone band. In this example, the setting is 0.75, representing 3/4 meter in this project.
- Base: Click to type in the distance below the planned survey path for the base of the payzone band. In this example, the setting is 0.75 (the top and base do not need to match).
- Depth Window: Use these settings to define the top and base depths to be represented in the diagram to be created. These represent measured depths along the well bore.
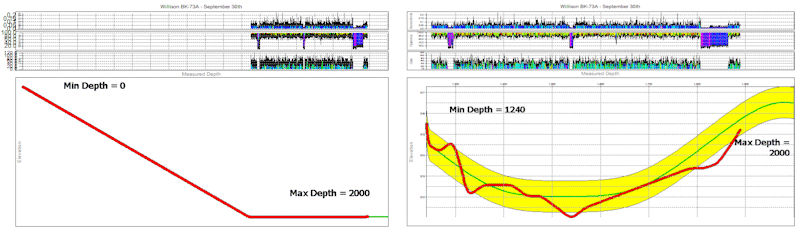
- Minimum: Click to the right to enter the top depth for the diagram. Typically this will be the measured depth slightly above the horizontal bearing of the hole. Note that if you start the diagram at a depth of 0 and the payzone is fairly deep, you won't get much resolution in the horizontal portion of the well. Compare the examples below.
- Maximum: Click to type in the base depth to be reprented in the diagram.
- Diagram Settings: Expand this heading to access the settings for the different portions of the diagram.
- Resistivity Annotation: Insert a check in this box if you wish to include title and value annotations for the resistivity pane. Expand this heading to access the interval and text options.
- Subdivision Interval: Click to the right to type in the interval at which the left axis of the resistivity curve will be labeled. This will relate to the magnitude and range of the curve values. In the example below, the Resistivity Subdivision Interval is set to 0.05. For reference the data values in this example range from 0 to 0.235.
- Font Size: Click to type in the size for the Resistivity labels. This value will relate to the scale in this portion of the graph, which can get a little tricky to define. Rule of thumb: Start with 1/10 the subdivision interval setting. In the example below the font size is 0.005.
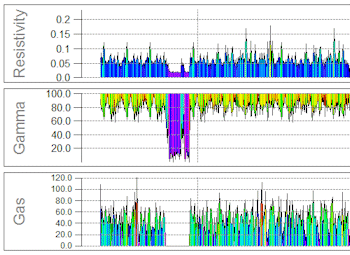
- Gamma Annotation: Insert a check in this box if you wish to include title and value annotations for the gamma value pane. Expand this heading to access the interval and text options.
-
- Subdivision Interval: Click to the right to type in the interval at which the left axis of the gamma curve will be labeled. This will relate to the magnitude and range of the curve values. In the example above, the Gamma Subdivision Interval is set to 20.0. For reference the data values in this example range from 0.6 to 100.
- Font Size: Click to type in the size for the Gamma value labels. This value will relate to the scale in this portion of the graph. Start with 1/10 the subdivision interval setting. In the example above the font size is 2.0.
- Mud Gas Annotation: Insert a check in this box if you wish to include title and value annotations for the Gas value chart. Expand this heading to access the interval and text options.
- Subdivision Interval: Click to the right to type in the interval at which the left axis of the gas curve will be labeled. In the example above, the Mud Gas Subdivision Interval is set to 20.0. For reference the data values in this example range from 0.0 to 120.9
- Font Size: Click to type in the size for the Mud Gas value labels. As above, this value will relate to the scale in this portion of the graph. Start with 1/10 the subdivision interval setting. In the example above the font size is 2.0.
- Wellpath:
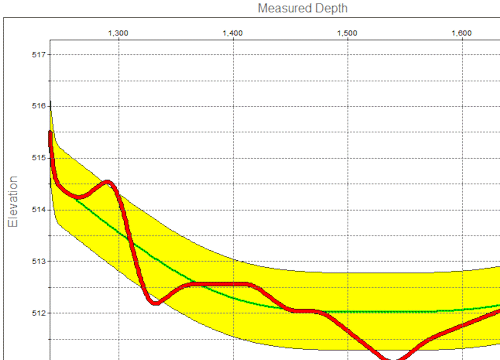
- Depth Interval: Click to the right to define the interval at which the measured depth values are to be displayed at the top of the diagram (increasing values left to right as you proceed horizontally across the diagram). In the example below, the interval is set to 100.
- Major Elevation Interval: Click to type in the interval at which the elevation values are to be displayed along the left side of the diagram (decreasing values top to bottom). In the example below, the interval is set to 1.
- Minor Elevation Interval: Click to enter the interval at which dotted horizontal lines are to be displayed within the diagram grid. If you don't need subdivisions, just set this to the same value as the Major Elevation Interval.
- Font Size: Click to the right to type in a size for the annotation labels. This is defined as a percentage of the project size (default = 0.02).
Step-by-Step Summary
- Access the RockWorks Utilities program tab.
- Create a new datasheet and enter or import the required input data.
Or, open the sample files and replace that data with your own. In the following example, the sample files are:
- Planned Survey: "RockWorks17 Data\Samples\GeoSteer_Planned_Survey_01.rwDat"
- Actual Survey: "RockWorks17 Data\Samples\GeoSteer_Actual_Survey_01.rwDat"
- Downhole Geophysics: "RockWorks17 Data\Samples\GeoSteer_Downhole_Geophysics_01.rwDat"
- Mud Gas: "RockWorks17 Data\Samples\GeoSteer_Mud_Gas_01.rwDat"
Be sure you've specified the units for the depths in the datasheets.
- Select the Survey | Lateral GeoSteering Diagram menu option.
- Enter the requested menu settings, described above.
- Click the Process button to continue.
The program will read the Planned Survey and Actual Survey data and generate the lower graph using the settings you defined.
It will then read the Mud Gas datasheet and generate the gas plot based on the options you established. The gas curve will be filled with cold-to-hot color bands.
It will read the datasheet containing the Gamma and Resistivity values and create those graphs, also filled with cold-to-hot color bands.
The graphs will be rescaled and assembled into the composite diagram. The diagram will be displayed in a RockPlot2D tab in the Options window.
- You can adjust any of the options along the left and click the Process button to regenerate the display.
! Each time you click the Process button, the existing display will be replaced.
- View / save / manipulate / print / export the chart in the RockPlot2D window.
 Back to Survey Menu Summary

RockWare home page