RockWorks | Utilities | Planes | Dip Direction & Angle -> Grid
Use this program to read XY locations, Z (elevations), and planar orientation data for a structural surface from the datasheet and, using the Dip Gridding algorithm, interpolate a structural grid model for the surface. You can create a 2D contour map and grid statistics report.
Menu Options
Step-by-Step Summary
Menu Options
- Input Columns: The prompts along the left side of the window tell RockWorks which columns in the input datasheet contain what data.
Click on an existing name to select a different name from the drop-down list.
- X (Easting): Column that contains the X or Easting coordinates for the measurement locations.
These can be Eastings in meters or feet, decimal longitudes, etc. See Defining your Datasheet Coordinates for more information.
- Y (Northing): Column that contains the Y or Northing coordinates for the measurement points.
- Z (Elevation): Column that contains the elevations.
These can be in meters or feet, but you need to be sure that you've defined the units in the column headings. See Defining your Datasheet Coordinates for details.
- Direction: Select the column that lists the dip direction or strike bearing (in 0 - 360 degrees). You can use a settings, below, to specify whether this is a strike or dip measurement.
- Dip Angle: Select the column that lists the dip angle (0 degrees = horizontal to 90 degrees = vertical, downward).
- Direction Represents... Use these settings only if you will be using the Dip Gridding algorithm and have specified input structural direction and angle columns above.
- Strike (Dip Based on "Right Hand Rule"): Choose this option if the Direction values defined above represent the strike bearing, with the dip direction being 90 degrees clockwise (right-hand rule).
- Dip Direction: Choose this option if the Direction values defined above represent the dip bearing.
- Declination Correction: Use this prompt to correct the directional data for magnetic declination. Click to the right to type in the correction amount.
- Output Grid: Click to the right to enter the name for the new grid model which will be created. Use "RwGrd" as the file name extension.
- Use All Points: Choose this option if all of the points with structural measurements are to be used in the interpolation for all grid nodes.
- Use Closest Points: Choose this if you want to limit the influence of the structural points.
- Maximum number of points: Use this setting to define the number of closest structure points to take into account when interpolating a node value.
- Use Distance Cutoff: Insert a check in this box if you want to apply a distance filter to this process, and type into the prompt the map distance, in your grid model units, beyond which a structure point will not have any influence on a grid node. This will represent horizontal distance between the grid node and the control point.
- Include Strike + Dip Symbols: Check this box to include strike and dip symbols at the locations where structural measurements are listed.
- Colors: Select how the strike and dip symbols will be colored.
- Fixed: Choose this option if all of the symbols and labels are to be plotted in the same color. Expand this heading and select the desired color by clicking on the color box to the right.
- Variable (Defined by Column): Choose this option if you have sample-specific colors listed in your datasheet. Expand this heading to select the column name.
- Column: Click on the name to the right to choose a different column name.
- Symbol Size: Click on this item to enter the size for the strike and dip symbols, declared in percent of your output dimensions. (Default = 2.0)
- Label Size: Click on this to enter the size for the dip angle labels, declared in percent of your project's output dimensions. (Default = 1.0)
- Line Thickness: Click to enter the thickness for the strike/dip symbols. 1 = thin lines, 3 = thick lines.
- Create 2-Dimensional Grid Diagram: Insert a check here if you want to display the output grid as a 2D map at this time. Expand this heading to set up the 2D map layers (bitmap, symbols, labels, line contours, color-filled contours, labeled cells, and/or map border).
- To activate a layer, insert a mark in its check-box.
- To access the layer's settings, expand the item by clicking on its "+" button. Then either click on the available button or expand the additional tree menu headings.
- Create Grid Statistics Report: Insert a check here if you want to see a report summarizing the output grid.
- Include Standard Deviation: Check this box if you want the report to include standard deviation.
- Include Directional Analysis: Check this box to include slope, aspect, and strike computations. Be warned that these can take a few moments for large grid models.
Step-by-Step Summary
- Access the RockWorks Utilities program tab.
- Create a new datasheet and enter/import your strike and dip data into the datasheet.
Or, open one of the sample files and replace that data with your own. (In the Samples folder, an example file = "\RockWorks17 Data\ Samples\Strike_and_Dip_Map_01.rwDat".)
- Select the Utilities | Planes | Dip Direction & Angle -> Grid menu optino.
- Enter the requested menu settings, described above.
- Click the Process button to proceed.
The program will read the XYZ points listed in the datasheet, along with any defined dip direction and angle measurements. Using the Dip Gridding algorithm, it will interpolate a grid model representing the elevations across the project area.
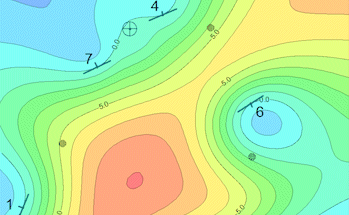
It will generate a map with the requested strike and dip symbols, contours, borders, etc. The completed map will be displayed in a RockPlot2D display tab.
If requested it will also generate a grid statistics report, which will be displayed in a text tab.
- You can adjust any of the settings in the Options window (map settings, etc.) and then click the Process button again to regenerate the map.
! Each time you click the Process button, the existing display will be replaced.
- View / save / manipulate / export / print the map in the RockPlot2D window.
 Back to Planes Menu Summary

RockWare home page