RockWorks | Utilities | EarthApps | Points Menu
These programs read XY locations from the Datasheet Editor or typed into a program prompt, and generate maps which illustrate the global locations with symbols, cones, cylinders, etc. in Google Earth.
Table of Contents
 Back to EarthApps Summary
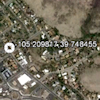
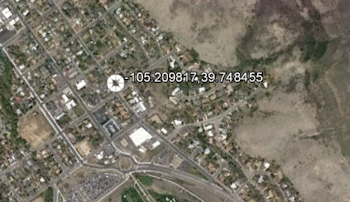
Quick Locator: Display a single point in Google Earth; a variety of coordinate systems are supported.
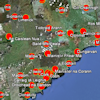
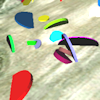
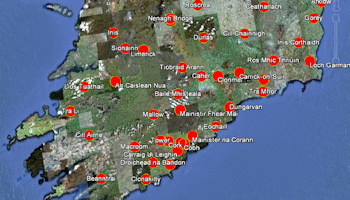
Icons: Create maps which illustrate X,Y locations with icon symbols.
- Simple: All of the icons will be the same size and color. Simple labels are available.
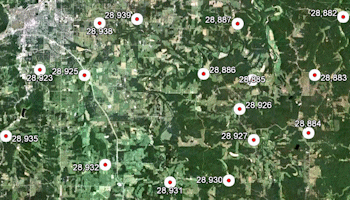
- Proportional: The size of the icons are scaled automatically by the program, based on a measured value in the datasheet. Simple labels are available.
- Advanced: This offers the most options - the size and design of the icons can be constant OR based on specific size and icon listings in the datasheet. Vertical placement of the icons can be fixed or variable. Labels and hotlinks are optional.

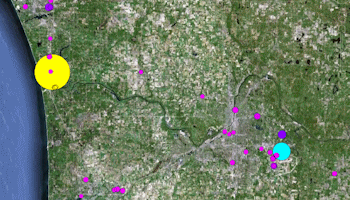
Circles: Create maps which illustrate X,Y locations with filled or outlined circles.
- Simple: All of the circles will be the same size and color. Simple labels are available.
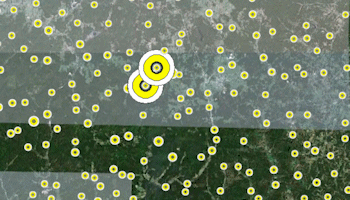
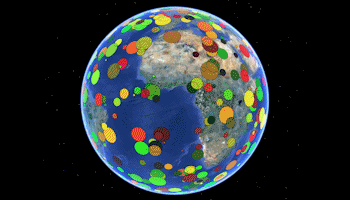
- Proportional: The size and color of the circles can be scaled automatically by the program, based on a measured value in the datasheet. Simple labels are available. This example shows how the circles are scaled and colored automatically (cold-to-hot colors) based on geochemical measurements listed in the datasheet.
- Advanced: The size and color of the circles can be constant OR based on specific size and color listings in the datasheet. This example shows how the circles are scaled based on size declarations and colored based on color listings in the datasheet.
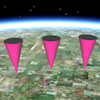
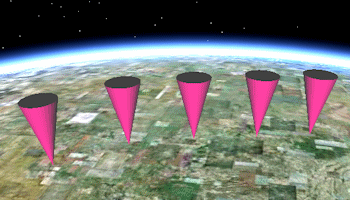
Cones: Create maps which illustrate X,Y locations with upward- or downward-facing cones.
- Simple: All of the cones will be the same size and color. Simple labels are available.
- Proportional: The size and color of the cones can be scaled automatically by the program, based on a measured value in the datasheet. Simple labels are available. This example shows how the cones are scaled and colored automatically based on geochemical measurements listed in the datasheet.
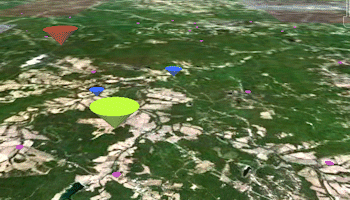
- Advanced: The size and color of the cones can be constant OR based on specific size and color listings in the datasheet. This example shows how cones can be sized based on actual meter measurements listed in the datasheet, and colored based on colors listed in the datasheet.

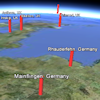
Cylinders: Create maps which illustrate X,Y locations with 3D cylinders.
- Simple: All of the cylinders will be the same size and color. Simple labels are available.

- Proportional: The size and color of the cylinders can be scaled automatically by the program, based on a measured value in the datasheet. Simple labels are available. This example shows how the cylinders are scaled and colored automatically based on C02 output listed in the datasheet.
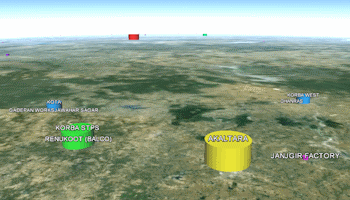
- Advanced: The size and color of the cylinders can be constant OR based on specific size and color listings in the datasheet.

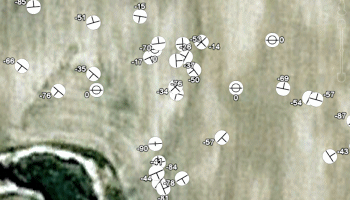
Strike and Dip: Create maps which illustrate X,Y locations with strike-and-dip symbols or discs.
- 2D: The output map has symbols rotated to indicate strike and dip direction. Simple labels are available.
- 3D - Simple: Strike and dip are represented with oriented discs, all of the same size and color.
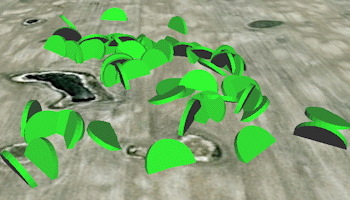
- 3D - Advanced: Strike and dip are represented with oriented discs, using the color, size, and thickness as listed in the datasheet.
Back to EarthApps Summary
"Google" is a trademark of Google Inc.

RockWare home page