Borehole Manager | Lithology Menu
RockWorks offers a selection of tools for the interpolation of observed lithology data into a solid model, for display as a 3D voxel diagram or sliced for display as a cross section, profile, fence diagram, or map. A variety of other lithology tools are available.
See also:
Lithology versus Stratigraphy for details about the difference between these data types
Striplogs for displaying observed data only.
Model-Based Diagrams - Model-Based Computations - Lithology Data Tools
Model-Based Diagrams: Interpolate a solid model from the borehole lithology intervals, or read an existing lithology model, for display as:
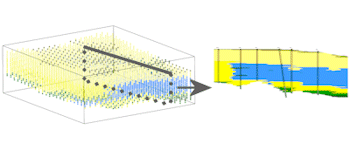
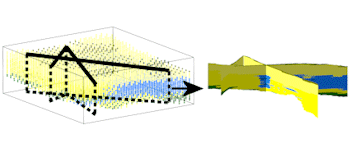
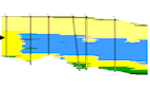
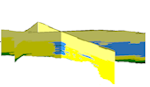
- Profile - A 2D profile sliced between two points
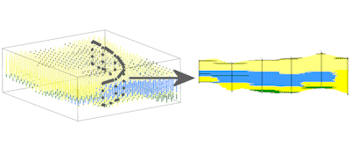
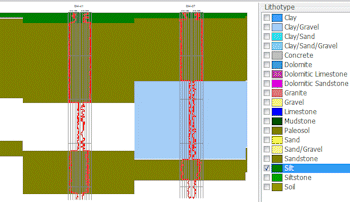
- Section - A multi-panel 2D cross section "sliced" between multiple points
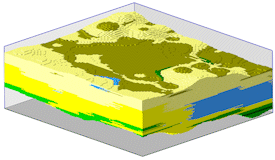
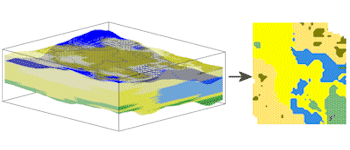
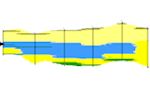
- Fence - A 3D fence diagram "sliced" between multiple points
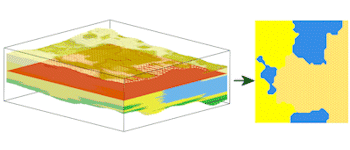
- Surface Map - A 2D geology map "sliced" along a specified surface model
- Plan Map - A 2D geology map "sliced" along a horizontal plane
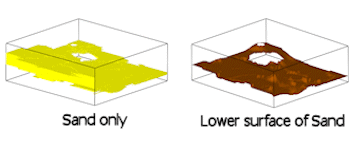
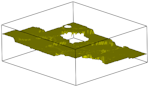
- Superface - A 2D or 3D map representing the uppermost occurrences of a specific lithology material (lithology structure map)
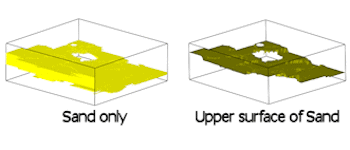
- Subface - A 2D or 3D map representing the lowermost occurrences of a specific lithology material (lithology structure map)
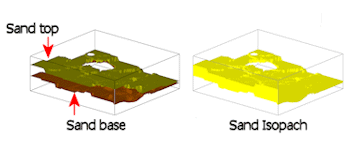
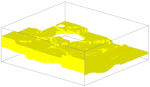
- Isopach (2D) - A 2D map representing the thickness of a specific lithology material (lithology isopach map)
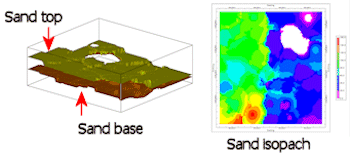
- Isopach (3D) - A 3D map representing the thickness of a specific lithology material (lithology isopach map)
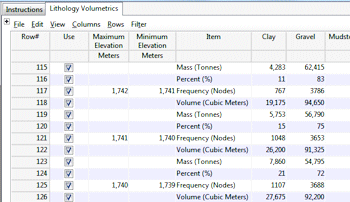
Model-Based Computations
- Volumetrics - Compute volumes of the different material types
Lithology Data Tools
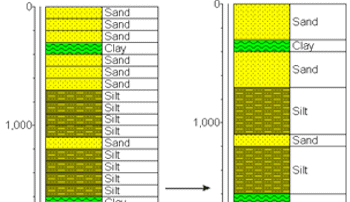
- Consolidate - Consolidate repeating lithology intervals in the database
- Pick Intervals - Pick lithology intervals from log data (geophysical curves, raster logs)
- Interpolate a solid model from the borehole lithology intervals, or read an existing lithology model, for display as:
|
|
|
|
 |
- a 2D profile "sliced" between two points in the study area
|
 |
|
|
 |
|
|
 |
|
|
 |
|
|
 |
- a 2D map or 3D map representing the uppermost or lowermost occurrences of a specific lithology material (lithology structure map)
|
 |
- a 2D map or 3D map representing the thickness of a specific lithology material (lithology isopach map)
|
 |
|
|
|
|
|
|
|
|
|
See also
RockWare home page