RockWorks | Borehole Manager | Lithology | Superface
Use this program to:
- Create a new 3-dimensional solid or block model representing interpolated lithology types (an .RwMod file) - OR - read an existing lithology .RwMod file you've already created.
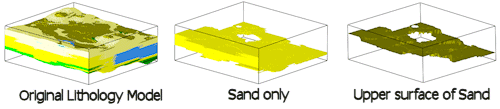
- Create a grid model (.RwGrd file) whereby the elevations represent the top of the shallowest occurrence of a selected lithology. A "null" value (-1.0e27) is assigned to any grid nodes that do not have a corresponding lithology within the original lithology block model. The resulting surface can be displayed in 2D and/or 3D.
See also: Creating a Lower Surface Model, a 2D Isopach, or a 3D Isopach for a Selected Lithotype
Menu Options
Step-by-Step Summary
Menu Options
- Lithology Modeling Options: First, tell the program whether you wish to use an existing lithology solid model (from a previous use of this tool or another Lithology menu tool) or you wish to create a new lithology solid model, by clicking in the appropriate radio button.
! NOTE This is not trivial. Creating the lithology model can take some time, depending on the resolution of the model and the detail of your data. If you already created a pleasing model for display as a profile, for example, you can use the same model, which was stored on disk as an .RwMod file, for the surface extraction and display.
- Create New Model: If you want to create a new model for the surface diagram, click in this radio button, and expand this item to establish the modeling settings.
- Spatial (XYZ) Filtering: Insert a check in this box, on the right side of the window, to activate a data filter based on spatial coordinates. Expand this heading to establish the filter settings.
Note that these tools filter the data that is passed to the modeling procedures. This is distinct from the filters that are applied once the model is completed, and described below.
- Create Filtering / Sampling Report: Check this box if you've activated the above filter and wish to see a listing of the filtered data.
- Lithology Model Name: Click to the right to enter a name for the lithologic model, such as "lithology". The program will append automatically the file name extension ".RwMod".
- Modeling Options: Click on the Options button to establish important modeling settings:
- Algorithm (Modeling Method): This determines the modeling method to use, for interpolating your lithology model. (More.)
- Additional Options: These include model dimensions, tilting, warping, filtering above-ground, smoothing, and much more.
- Limit Input to Selected G Values: Check this box to filter the input data. (More.)
- Limit Model to Selected G Values: Check this box to filter the output model. (More.)
- Use Existing Model: If you wish to use an already-existing lithology model, click in this radio button, and expand this item to select:
- Model Name: Click on this item to browse for the name of the existing lithology model (.RwMod file) to be used for this surface extraction and diagram.
- Lithologic Unit: Click here to select the name of the lithology material type for which you want to create the elevation surface. The list of materials you see here is pulled from the Lithology Types Table in the current project database.
- Output Grid: Click here to type in the name to assign the output grid that will be created, such as "sand_superface.RwGrd". This grid model's nodes will represent the elevations of the uppermost occurrence of the selected lithology type in the new or existing model.
- Create 2-Dimensional Grid Diagram (Map): Insert a check here if you want to display the output grid as a 2D map at this time. Expand this heading to set up the 2D map layers (bitmap, symbols, labels, line contours, color-filled contours, labeled cells, and/or map border).
- To activate a layer, insert a mark in its check-box.
- To access the layer's settings, expand the item by clicking on its "+" button. Then either click on the available button or expand the additional tree menu headings.
- Create 3-Dimensional Grid Diagram (Surface): Insert a check here if you want to display the output grid as a 3D surface at this time. Expand this heading to set up the 3D options.
! You can request both a 2D and 3D representation of the grid model.
- 3D Surface Options: Click on this button to establish the color and other surface settings.
- Reference Cage: Check this box to include a 3D grid of reference lines and labels with the diagram. Expand this heading to access the cage options.
- Create Grid Statistics Report: Insert a check here if you want to see a report summarizing the output grid.
- Include Standard Deviation: Check this box if you want the report to include standard deviation.
- Include Directional Analysis: Check this box to include slope, aspect, and strike computations. Be warned that these can take a few moments for large grid models.
Step-by-Step Summary
- Access the RockWorks Borehole Manager program tab.
- Enter/import your data into the Borehole Manager. This tool specifically reads location, orientation (if any), and lithology data.
- Select the Lithology | Superface menu option.
- Enter the requested menu items, described above.
- Click the Process button to continue.
If you've selected Use Existing Model, the program will load the information from the existing lithology model (.RwMod file), and will proceed to surface extraction and diagram generation.
If you've selected Create New Model, the program will scan the project database and extract the borehole locations, lithology depths and materials, and any borehole orientation. It will apply any source data filters you have requested, and will interpolate the solid lithology model.
- If you have requested model size confirmation, the program will display a window at this time. Adjust these dimensions as necessary and click OK to continue. (More.)
The program will create a solid model (.RwMod file) of the lithology types in the project, coding the lithotypes the numeric value declared in the Lithology Types Table. The completed model will be stored on disk under the indicated file name.
Once the new model is created or the existing model loaded, Rockworks will then determine the uppermost elevation for the requested material in each vertical column of nodes in the input lithology model. That elevation will be stored in the corresponding node in the output grid model. Any locations for which there are no occurrences of the selected material, a null value will be assigned in the output grid.
If requested, the program will create a 2- or 3-dimensional image representing the grid model. The requested diagram(s) will be displayed in a RockPlot2D tab and/or RockPlot3D tab in the Options window. If you requested a statistics report, it will be displayed in a Text Tab in the Options window.
- You can adjust any of the modeling or diagram options in the pane to the left and then click the Process button again to regenerate the surface map.
! Each time you click the Process button, the existing grid model and map display will be replaced.
- View / save / manipulate / export / print the diagram in the RockPlot2D or RockPlot3D window.
See also:
 Back to Lithology Menu Summary

RockWare home page