RockWorks | Borehole Manager | Lithology | Isopach (2D)
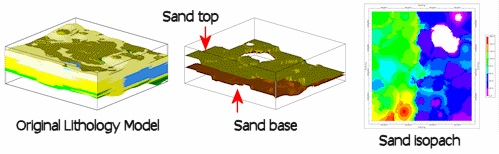
Use this program to read an existing lithology solid model (an .RwMod file) and determine the uppermost and lowermost elevations for a selected lithology type in each vertical column of nodes in the input model. The thickness of this interval - regardless of materials that lie between - will be stored for the corresponding node in the output grid model (.RwGrd file). A "null" value (-1.0e27) is assigned to any grid nodes that do not have a corresponding lithology within the original lithology block model. The resulting isopach can be displayed as a 2D map.
! This tool requires that you've already created a lithology model (.RwMod file).
! This tool does not take into consideration any material types that lie between the uppermost and lowermost occurrences of the selected lithotype.
See also: Creating an Upper Surface Model, a Lower Surface Model, or a 3D Isopach for a Selected Lithotype
Feature Level: RockWorks Standard and higher
Menu Options
Step-by-Step Summary
The program will determine the uppermost and lowermost elevations for the requested material in each vertical column of nodes in the input lithology model. The difference between these elevation values (e.g. thickness) will be stored in the corresponding node in the output grid model. Any locations for which there are no occurrences of the selected material, a null value will be assigned in the output grid.
The program will create the 2-dimensional image representing the grid model, using the requested map layers. The requested diagram(s) will be displayed in a RockPlot2D tab in the Options window.
! Note: The grid model that is generated, and the map which represents it, is based on all voxels from the uppermost occurrence of the designated lithology to the lowermost occurrence. This means that other lithologies may exist between these two surfaces.
! Each time you click the Process button, the existing grid model and map display will be replaced.
See also:
![]() Back to Lithology Menu Summary
Back to Lithology Menu Summary
![]()