RockWorks | Utilities | Linears | Arrow-Map
This program is used to read line endpoint coordinates from the datasheet and create a map in which lineations are represented with arrows plotted from the beginning to the ending coordinate pair.
Menu Options
Step-by-Step Summary
Menu Options
- Input Columns: The prompts along the left side of the window tell RockWorks which columns in the input datasheet contain what data.
Click on an existing name to select a different name from the drop-down list.
- X1, Y1: Select the names of the columns in the data sheet that contain the X and Y coordinates for the beginning points of the lineations.
These can be Eastings in meters or feet, decimal longitudes, etc. See Defining your Datasheet Coordinates for more information.
- X2, Y2: Select the columns that contain the X,Y coordinates for the endpoints of the lines.
- Line Colors & Styles: Use these settings to define how the arrows will be plotted.
- Uniform: Select this option to plot all arrows using the same line style and color.
- Line Style: Click on the sample to select the fixed style and color.
- Defined by Column: Choose this option if you have line styles listed in the datasheet.
- Column: Click on the column name displayed to the right to choose the name of the column where the lines are listed.
- Omit Short Arrows: Insert a check in this check-box to omit arrows less than a specified length. Expand this item to specify the minimum length, in your map units.
- Arrowhead Type: Expand this item to choose either hollow or filled arrowheads.
- Head Size: Click here to enter a size for the arrowhead, as a percent of map width. A value of "1.0" will create arrowheads that are approximately 1% of the width of the map.
- Border: Check this to include a border around the arrow map which shows the coordinate range of the axes. Expand this heading to establish the border options.
Step-by-Step Summary
- Access the RockWorks Utilities program tab.
- Create a new datasheet and enter/import your line endpoint (X1Y1X2Y2) data into the datasheet.
Or, open one of the sample files and replace that data with your own. (In the Samples folder, an example file = "\RockWorks17 Data\ Samples\Arrow_Map_01.rwDat".)
- Select the RockWorks | Utilities | Linears | Arrow Map menu option.
- Enter the menu settings (above).
- When all of the settings are established to your satisfaction, click the Process button at the bottom of the window.
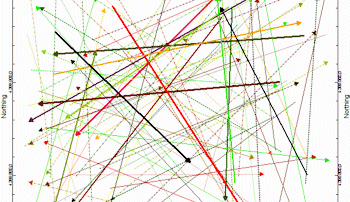
The program will create a map with the lineations represented with arrows, plotted from the lineation beginning to ending points. The lengths shown will represent actual lineation lengths as given by the input X and Y coordinates. The completed map will be displayed in a RockPlot2D tab in the Options window.
- You can adjust any of the settings in the Options window (diagram settings, etc.) and then click the Process button again to regenerate the map.
! Each time you click the Process button, the existing display will be replaced.
- View / save / manipulate / export / print the map in the RockPlot2D window.
See also
 Back to Linears Menu Summary

RockWare home page