RockWorks | Utilities | Linears | Lineation Gridding
This program is designed to read lineation data (in X1, Y1, X2, Y2 endpoint coordinate format), and create a grid file that models the lineation frequency, cumulative lengths, and/or intersections, with a variety of weighting options. The resulting grid model can be illustrated as a 2D or 3D map.
Menu Options
Step-by-Step Summary
Menu Options
- Input Columns: The prompts along the left side of the window tell RockWorks which columns in the input datasheet contain what data.
Click on an existing name to select a different name from the drop-down list.
- X1, Y1: Select the names of the columns in the data sheet that contain the X and Y coordinates for the beginning points of the lineations.
These can be Eastings in meters or feet, decimal longitudes, etc. See Defining your Datasheet Coordinates for more information.
- X2, Y2: Select the columns that contain the X,Y coordinates for the endpoints of the lines.
- Azimuth Filter: Expand this heading to turn on or off filters based on azimuth bearing.
- Azimuth Filter #1: If you wish to omit lineations from the computations based on their bearing, insert a check in this box. Expand this item to establish the bearing filter range. The program will assume this is bi-directional.
- Azimuth Filter #2: If you wish to invoke a second filter, insert a check here and follow the instructions for the Filter #1, above.
! NOTE: The maximum azimuth must be designated in a clockwise manner from the minimum. If the desired range crosses North (bearing = 0), it is possible to enter a Minimum azimuth that is greater than the Maximum. For example: You can filter for northerly-bearing lineations ranging from a minimum of 315 to a maximum of 45.
- Length Filter: If you wish to exclude lineations from the computations based on their computed length, insert a check in this check-box. Expand this item to establish the filter range. The lengths should be entered in the units defined in the Output Dimensions.
- Minimum: Insert a check here if you wish to establish a minimum length for lineations to be included, and enter the minimum acceptable lineation length. Any line whose computed length falls below this threshold will be omitted from the computations.
- Maximum: Insert a check here if you wish to establish a maximum length for lineations to be included, and enter the maximum acceptable lineation length. Any line whose computed length is above this threshold will be omitted from the computations.
- Tip: Use the Linears | Lineation Properties tool to compute and record the length of each lineation in the datasheet.
- Frequency Grid: Insert a check here to create a lineation frequency grid, in which each grid cell represents the number of lineations that lie in the cell. This includes lines that originate in the cell, end in the cell, and simply pass through the cell.
- Length Grid: Insert a check here if you want to create a lineation length grid, in which each cell represents the total lengths, added together, of all of the lineations that pass through the cell. (The total length of each line is included, not just the length of the portion of the line that lies within the cell.)
- Intersection Grid: Check this option if you want to create a lineation intersection grid in which each cell represents the number of lineation intersections that occur within the cell.
- Statistical Manipulations: Expand each of these options to establish how the numbers will be recorded in the output grid file. Choose from:
- No manipulations: Using this setting, the frequency, length, and/or intersection values will be recorded in the grid model as they were computed.
- Normalize: With this setting, the real number frequency, length and/or intersection grid node values will be normalized to range between 0 and 1.
- Standardize : With this setting, the program will compute the real number frequency, length, and/or intersection node values, determine the mean node value and the standard deviation, and will store all computed node values in terms of standard deviations above and below the mean.
- Weighting Factor: If you have requested more than one type of model be represented in the final grid file (e.g. you have selected more than one of the Length, Frequency, and Intersection grids), you can assign a weight or influence of each in the output model.
How this works: The program combines the Length, Frequency, and/or Intersection grids into the final model simply by adding them together. If you set the weighting factor to a number other than "1," the nodes in the intermediate grids will be multiplied by that value before being combined with the other intermediate grids.
A weighting factor of "1" means the intermediate grid will be combined as-is with the other intermediate grids (regardless of the statistical manipulation requested). A weighting factor of "0.5" means the nodes of the intermediate grid will be halved in value before being combined with the other intermediate grids. A weighting factor of "2" means the nodes of the intermediate grid will be doubled in value before being combined with the other intermediate grids.
- Output Grid: Click on the displayed .rwGrd name to the right to change the name under which the final lineation grid model is to be stored.
- Model Dimensions: Expand this heading set the grid dimensions. (More.)
- Create 2-Dimensional Grid Diagram: Insert a check here if you want to display the output grid as a 2D map at this time. Expand this heading to set up the 2D map layers (bitmap, line contours, color-filled contours, labeled cells, and/or map border).
- To activate a layer, insert a mark in its check-box.
- To access the layer's settings, expand the item by clicking on its "+" button. Then either click on the available button or expand the additional tree menu headings.
- Create 3-Dimensional Grid Diagram: Insert a check here if you want to display the output grid as a 3D surface at this time. Expand this heading to set up the 3D options.
! You can request both a 2D and 3D representation of the grid model.
- Color Scheme: Click on this button to establish the surface's color scheme.
- 3D Surface Options: Click on this button to establish the color and other surface settings.
- Reference Cage: Check this box to include a 3D grid of reference lines and labels with the diagram. Expand this heading to access the cage options.
! Bear in mind that the grids output from this program don't represent elevation. You'll need to set the cage dimensions to Automatic rather than to comply with the Output Dimensions.
- Create Grid Statistics Report: Insert a check here if you want to see a report summarizing the output grid.
- Include Standard Deviation: Check this box if you want the report to include standard deviation.
- Include Directional Analysis: Check this box to include slope, aspect, and strike computations. Be warned that these can take a few moments for large grid models.
Step-by-Step Summary
- Access the RockWorks Utilities program tab.
- Create a new datasheet and enter/import your line endpoint data (X1Y1X2Y2) into the datasheet.
Or, open one of the sample files and replace that data with your own. (In the Samples folder, an example file = "\RockWorks17 Data\ Samples\Lineation_Map_01.rwDat".)
- Select the Utilities | Linears | Lineation Gridding menu option.
- Enter the requested menu items, described above.
- When all of the settings are established to your satisfaction, click the Process button at the bottom of the window.
The program will read the measurements from the data sheet. If you have requested confirmation of the grid dimensions, the program will display a summary window with the grid boundary coordinates and node spacing. The boundaries correspond to the outside points of all of the lineations. You may adjust the grid dimensions as necessary and click OK. (More.)
If you have activated the Confirm Intervals setting for either Contour Lines or Colored Intervals, the program will display a summary window with default contour intervals. Adjust these items if necessary and click OK.
The z-value units in the map will represent counts (frequency or intersections) or lengths if you’re creating a single grid model with no alterations, or normalized or standardized values if these operations were requested.
The program will create the requested lineation grid model(s), weighting and combining them if multiple models were selected, storing the resulting numeric grid file on disk if you so requested. If you have requested a diagram, it will be created and displayed on the screen.
- You can adjust any of the settings in the Options window (diagram settings, etc.) and then click the Process button again to regenerate the model and map.
! Each time you click the Process button, the existing display will be replaced.
- View / save / manipulate / print / export the map in the RockPlot2D and/or RockPlot3D window.
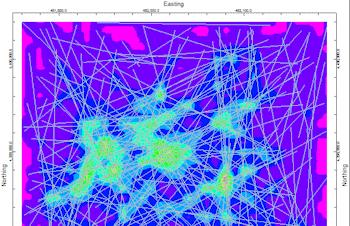
Tips: Combine your 2D lineation density map with a lineation map, as in the example at the top of this page. Maps can be combined using the RockPlot2D File | Append tool.
 Back to Linears Menu Summary

RockWare home page