RockWorks | Utilities | HydroChem | Stiff
This program is used to read a listing of ion concentrations from the datasheet and create a Stiff diagram for groundwater ion concentration analysis.
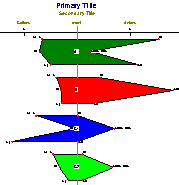
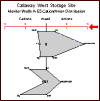
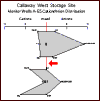
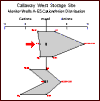
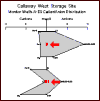
Here is a summary of all of the parts of a Stiff diagram. Inclusion of many of the components is determined by settings available in the Stiff Diagram Options window.
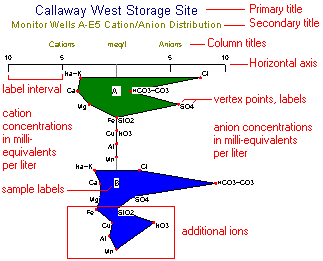
Stiff diagrams plot milli-equivalent concentrations of cations on the left side of the diagram and of anions on the right. Each ion is plotted as a point, and the points are connected to form a polygonal shape. The ions are plotted in a consistent order (Na+K across from Cl; Ca across from HCO3 + CO3; Mg across from SO4) so that each polygon becomes that sample's "signature". Additional ions, if present, are plotted in the order that they are listed, below the standard ions.
Concentrations entered in the source data file in units of milligrams per liter are converted to milli-equivalents per liter for display on the diagram. (See Conversion Factors.)
Menu Options
Step-by-Step Summary
- Input Columns: These prompts tell RockWorks which columns in the current datasheet contain the input data.
Click on an existing name to select a different name from the drop-down list.
- Sample ID: If you have sample numbers listed for your sites, choose the column where these are listed. These will display inside or outside the Stiff polygons.
- Symbol: Choose the column that lists specific symbols for the individual samples.
- Na, K, Ca, Mg: Choose the columns that list these required cations. The measurements must be listed in ppm or mg/l units.
- Cl, HCO3, CO3, SO4: Choose the columns that list these required anions. The measurements must be listed in ppm or mg/l units.
- Additional Cations
- Cation A, B, C, D: Use these checkboxes to turn on up to 4 additional (non-standard) cations to be included in the Stiff diagram polygons. Click in each check-box to turn an ion on or off.
- Data Column: For each cation that you activate, select the name of the column in the current datasheet where the data is listed.
- Conversion Factor: For each cation that you activate, you also need to declare a conversion factor to convert from ppm or mg/l to milli-equivalents. See Conversion Factors for help.
! This is important - RockWorks will not know this conversion factor automatically. You need to enter it manually.
- Additional Anions
- Anion A, B, C, D: Use these checkboxes to turn on up to 4 additional anions to be included in the Stiff diagram polygons. Click in each check-box to turn an ion on or off.
- Data Column: For each anion that you activate, select the name of the column in the current datasheet where the data is listed.
- Conversion Factor: For each anion that you activate, declare a conversion factor to convert from ppm or mg/l to milli-equivalents. See Conversion Factors for help.
! As above, this is important - RockWorks will not know this conversion factor automatically. You need to enter it manually.
- Titles: Click on this tab to specify text, if any, for the main and secondary diagram titles. You may enter up to 60 characters for each title. Click the color box to the right to select their color.
- Diagram Options
- Scaling
- Select Automatic to have the program determine the range of the horizontal scale bar automatically, based on the maximum ion concentration on each page, or on all pages. Automatic scaling is handy for the first runs with a data set, and if your data is pretty consistent throughout.
- All Diagrams = Same Scale: Check this option if you want the automatic scaling to be sure that all diagrams on all pages plot at the same scale. If not-checked, then diagrams on separate pages may scale differently.
- Cation Range = Anion Range: Check this option for the program to dimension the left and right sides to equal ranges.
- Or select Manual to set the scale bar range to the milli-equivalents/liter values that you enter in the prompt boxes. Manual scaling is handy if you want different pages of a data set or different data sets to be shown at the same scale.
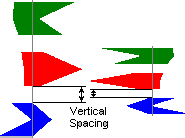
- Vertical Point Spacing: Use this to define how far apart the sample points are plotted and how stretched the Stiff polygons will appear. Note that samples with more ions will be generate longer polygons than those with fewer ions, even if the point spacing is constant.
-
- Text and Point Scaler: Use this setting (default = 1) to increase or decrease all text and vertex point sizes universally. Use Polygons per page (below) to define how many Stiff diagrams are on each graphic "page".
- Diagram Options: Use these settings to define the diagram components and colors.
 |
Column titles: Check this item to plot titles above the horizontal axis and enter the title text and color. |
 |
Horizontal Axis: Check this item to plot a horizontal axis line with tick marks and labels. Click this tab to set the tick & label increments and color. The appropriate increment to enter will depend on the concentration ranges of your data. See Scaling, above, to establish the range of the horizontal scale bar. |
 |
Vertical Axis: If activated, the program will draw a line of the specified color in the midline of the diagram. |
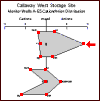 |
Vertex Points: If there is a check in this box, the program will include solid circle points at each vertex of the Stiff polygons. The program will not use the symbols stored in the main datasheet. Click this tab to select the point color. The size of the symbols is controlled by the Text and Point Scaler setting, described above. |
 |
Vertex Labels: If activated, the vertex points will be labeled with the ion represented there. Select the color by clicking on the color box. |
 |
Sample Names: If you want each polygon to be labeled with the sample number, insert a check in this box. Click on this tab to select label color and whether the label is to be plotted inside or outside the polygon. Note that if you selected centered positioning and have Fill Polygons checked (below), you will need to be sure that the text color is set dark enough to be visible. |
 |
Fill Polygons: Insert a check here if you want the polygons to be filled with solid color rather than drawn as outlines. The colors used are those specified for the Symbols in the main datasheet. |
 |
Border: Insert a check here to surround each diagram by a solid line border. Leave this box unchecked if the diagram should not include a border. |
- Polygons per Page: Enter here the number of polygons that are to be plotted on each page. The program will create a separate plot window for each page of polygons.
Note that if you are creating multiple pages and you've selected Automatic scaling for the horizontal axes but have not checked "All Diagrams = Same Scale", each page may represent different scaling.
- Multipage Warning: Insert a check here if, prior to creating a Stiff diagram, the program is to display a message box warning you that more than one page of polygons is going to be created. The number of pages that will be created depends on the number of samples in the datasheet, the number of polygons you have requested per page, and the point spacing.
- Other 2D Diagram Options
Use these checkboxes to append other layers to your diagram.
Click each tab to set up the 2D diagram layers.
- Other 2D Files: Append other saved Rockplot2D diagrams
- Peripherals: Add a logo, title block, or other peripheral items to your diagram.
- Output Options
- Save Output File: Check this to assign a name for the map in advance, rather than displaying it as Untitled.
- Automatic: Choose this option to have RockWorks assign the name automatically. It will use the name of the current program plus a numeric suffix, plus the ".Rw2D" file name extension.
- Manual: Choose this option to type in a name of your own for this file.
- Display Output: Check this option to have the resulting map displayed in RockPlot2D once it is created.
- Access the RockWorks Datasheet program tab.
- Create a new datasheet and enter/import your hydrochemistry data into the datasheet.
Or, open one of the sample files and replace that data with your own. See Data Layout for datasheet examples.
! Click the Example button at the top of the window to load a sample file that is installed with the program.
- Select the HydroChem | Stiff Diagram menu option.
- Enter the requested program settings, described above.
- Click the Continue button to proceed.
The program will read the ion concentration information from the datasheet, convert the ppm or mg/l measurements to milli-equivalents per liter based on the conversion factors. For each sample, cations will be represented with points along the left side and anions with points along the right side, scaled horizontally based on their milli-equivalent values and the requested horizontal scaling. Vertical spacing of points will be based on the requested point spacing. Required ions are drawn in a specific order; additional ions are drawn as points below them. The points in each sample will be connected to form a polygonal shape; the polygon will be filled with solid color if requested.
Multiple pages may be required if there are more samples in the datasheet than have been established as the Polygons per Page setting. The program will display a multiple-page notice if you have requested this; you may cancel the plotting process if you wish.
- You can adjust any of the diagram options along the left and click the Continue button to regenerate the plot.
- View / save / manipulate / print / export the diagram in the RockPlot2D window.
 Back to Hydrochemistry Menu Summary

RockWare home page