- Access the RockWorks Datasheet and open the Samples project folder, as described earlier. (Remind me…
 )
)
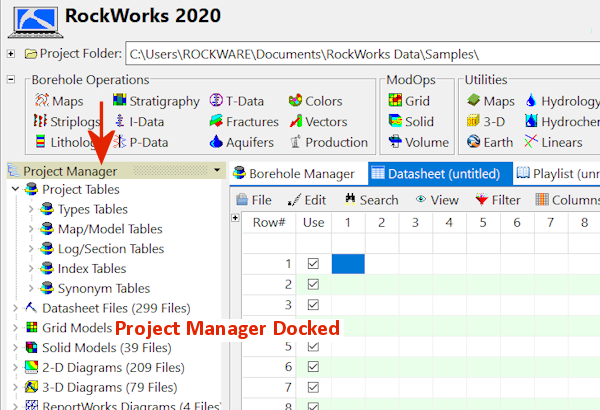
- Locate the Project Manager program tab or docked pane. Here you'll see groupings of a variety of different RockWorks file types in the Samples folder.
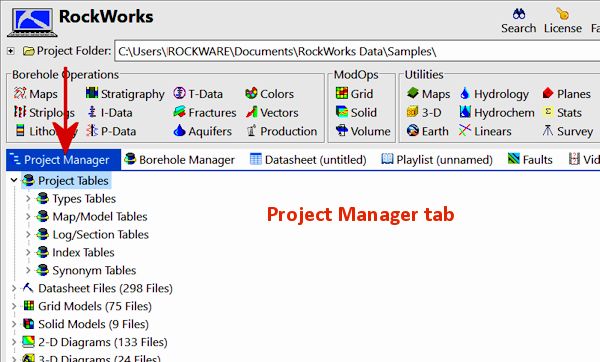
- Expand the Datasheet Files heading in the Project Manager. You will see a long list of sample data files.
- Locate the file Maps_Soil_Properties.RwDat, and double-click on it. The program will load the contents of the data file into the RockWorks Datasheet.
This particular file contains borehole IDs, symbols, X (easting) and Y (northing) location coordinates, surface elevation at those sites, and a number of soil measurements. This is a basic "XYZ" file that we can use for creating point maps and contour maps.
! RockWorks permits you to organize your data almost any way you like. Any time you want to create a map or diagram, you can specify which columns in the datasheet contain what type of data.
- View the Column Parameters: Right-click in the column heading for the ID column and select Column Properties from the pop-up menu. (This is also available under View | Column Properties.) You will see the Datasheet Setup pane to the right.
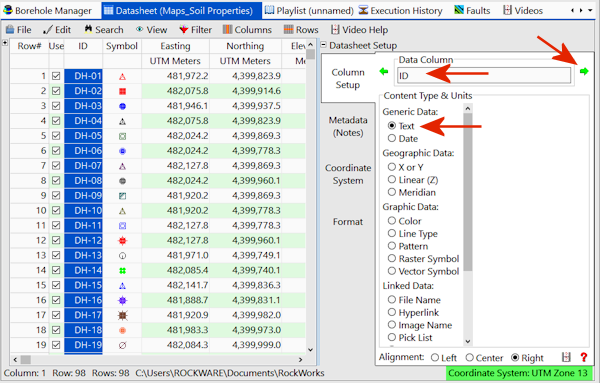
This is where you can assign the column title and column type. The ID column is a generic Text column.
- Click the green arrow at the top of the window
 to proceed to the next column's settings.
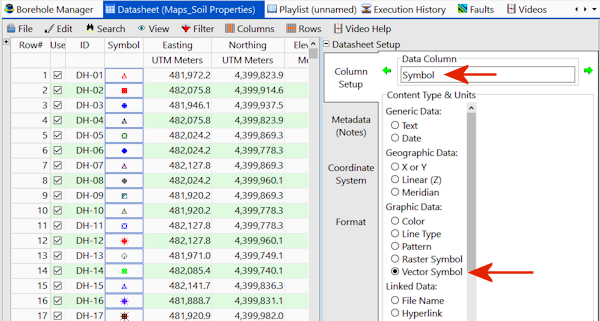
Here you'll see that the Symbol column is set up to be a Graphic column containing Vector Symbols. This tells RockWorks to display graphic symbols in this column.
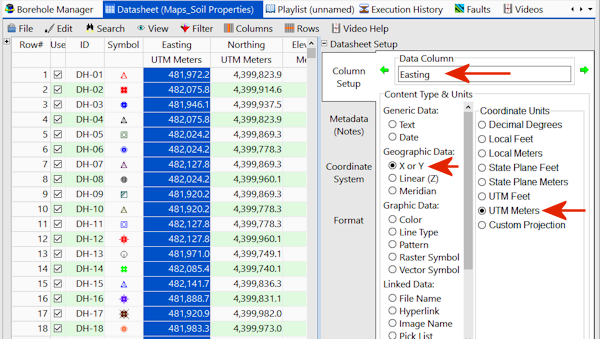
- Click the green arrow at the top of the window again to advance to the Easting column.
This column contains coordinates representing Geographic Data. Here you can specify the coordinate type and the units.
! X and Y coordinate columns must have type and units selected for map creation. In your own work, if you don't know/don't care what your coordinates represent, just choose Local Feet or Local Meters as appropriate.
- Click the green arrow to advance to the Northing column - it's also set as a Geographic Datacolumn, with coordinate system and units selected.
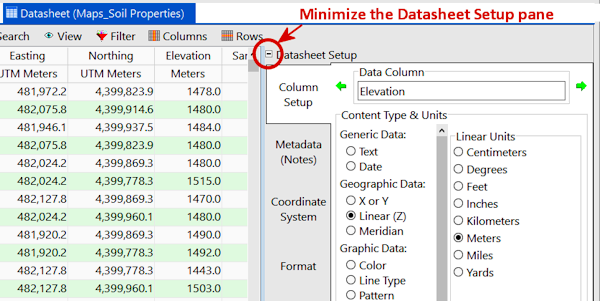
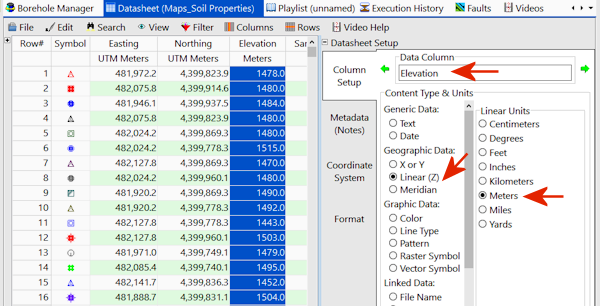
- Advance to the next column, Elevation. This is set to a Linear (Z) column type, with units also selected.
- Continue scrolling through the columns in this datasheet to see their setup.
- You can leave the Datasheet Setup pane open, or you can minimize it using the small "-" button at the top.