![]() Estimated time: 9 minutes.
Estimated time: 9 minutes.
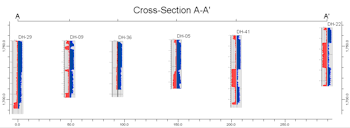
In this lesson, you will be creating an image representing the Gamma and Resistivity measurements as curves in multiple logs in the Samples project, selected along a multi-log cross section trace.
DH-30
DH-03
DH-21
DH-40
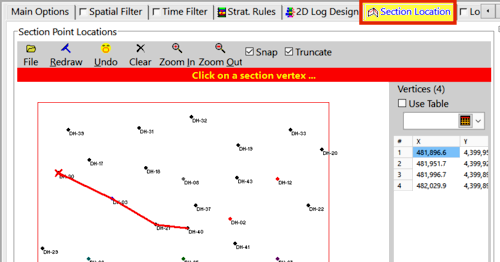
481896.8 4399952.0
481953.3 4399923.8
481997.6 4399898.1
482031.0 4399892.9
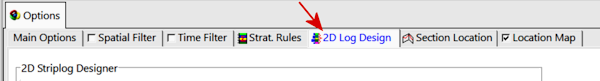
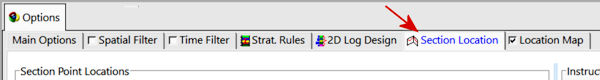
The program will display the 2D log designer window. This window has three main sections:
a. Choose the items you want to see in the logs by inserting a check-mark in the following items in the left pane:
b. Adjust the arrangement of the visible log items: You should see five items in the upper Preview pane: title, depth bar, log axis, and two P-Data columns.
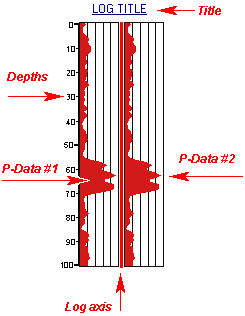
! Note that the log axis is always activated, it acts as the anchor point for the log. The axis will be placed at the actual log location in the diagrams. The log title is always placed atop the axis.
c. Check the options for each visible item by clicking on the item's name in the listing; its options will be displayed in the Options pane.
! You can drag the splitter between the Preview and the Options panes to create space, if necessary.
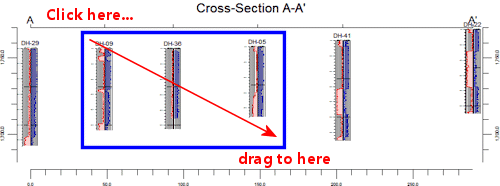
The program will create strip logs of each of the selected borings using the selected settings. The logs will be spaced proportionally to their distance from each other on the ground. The completed cross section will be displayed in a RockPlot2D tab, where 2-dimensional maps and other diagrams are presented.
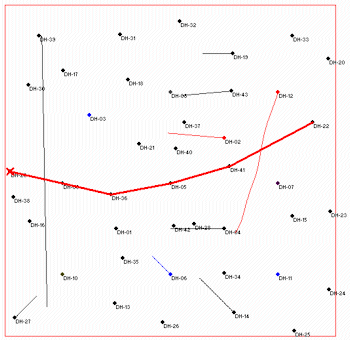
In addition, it will create a map that displays the location of the section slice within the study area. The completed map will be displayed in a second RockPlot2D tab.

See also: RockPlot2D tutorial
![]() Displaying Multiple Logs in a 2D Hole to Hole Section
Displaying Multiple Logs in a 2D Hole to Hole Section
![]()