This section of the Borehole Manager tutorial contains lessons for creating diagrams to illustrate quantitative data that is entered into the project's I-Data table. I-Data simply refers to downhole samples that are measured over depth intervals rather than at depth points. This is commonly used for geochemical and geotechnical data.
If you have already done the lithology or stratigraphy lessons, some of these procedures will be very much the same. However, rather than illustrating rock types only in logs, the downhole interval data will be illustrated as bargraphs in the logs. A solid model will be created to illustrate the isosurface, multi-panel section, and fence diagram.
(See also time-based interval data lessons in the T-Data section.)
Pick a lesson by clicking on its arrow. We recommend going through these lessons in the order listed.
![]() If this is the first lesson set you’ve done, please be sure you’ve (1) restored the program defaults, (2) opened a project folder, and (3) set the project dimensions.
If this is the first lesson set you’ve done, please be sure you’ve (1) restored the program defaults, (2) opened a project folder, and (3) set the project dimensions.
| Tutorial Lesson | Minimum licensing level |
|
| Look at the Interval Data layout. See how the data columns and values are defined, how to edit the data as a spreadsheet, how to generate a frequency histogram of values *, and how to query based on I-Data values. (* requires Standard level) |
Basic (or Trial) |
|
| Display I-Data logs in 3D. This offers a quick, overall view of the Benzene Soil data as entered, across the project. |
Basic (or Trial) |
|
| Display I-Data logs in a 2D cross section. This shows the Benzene Soil measurements for selected boreholes in a multi-log cross section diagram. |
Basic (or Trial) |
|
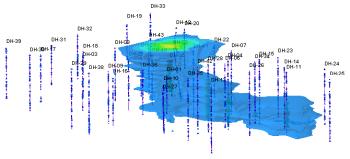
| Create a 3D I-Data isosurface diagram. Here you will interpolate the log data into a continuous solid model and display it as an isosurface. |
Standard (or Trial) |
|
| Create an interpolated I-Data cross section. Using the interpolated model, you'll display connected slices in a cross section diagram. |
Standard (or Trial) |
|
| Create an I-Data fence diagram. Using the interpolated model, you'll display multiple panels in a 3D fence diagram. |
Standard (or Trial) |
![]() Back to main menu
Back to main menu
![]()