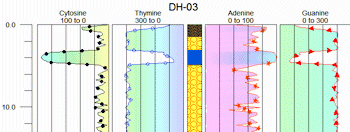
Use the Striplog P-Data check-box(es) to plot downhole point data as curves in a striplog. Up to 4 curves can be included in each log. The data is read from the RockWorks Borehole Manager's P-Data (Points) data table.
When you click on the P-Data items in the layout window you’ll see the following settings in the pane to the right. Note that you can activate all of the P-Data columns, and establish their settings, independently.
- Track: Use this setting to tell the program which column of values in the P-Data table you wish to plot for the selected curve column (#1, #2, #3, #4). When you click on this item, the program will display the current list of track names; click on a name to make a selection. Each P-Data column you activate can read from a different track.
- G-Value Filter: Insert a check here to discard or replace high and/or low data values from the selected track for display in the logs. Subsequent automatic scaling of the P-Data columns will be based on the resulting G value range. (More info)
- Resample: Insert a check here to resample the data from the selected track for display in the logs. This is very useful when dealing with large datasets with closely sampled downhole data. (More info)
- Column Layout
- Left Margin: Determines the space between the curve column and the item to its left, as a percent of the project output dimensions. The greater the value, the wider the space. Default = 0.1.
! You can use a negative value to move the column to the left, to overlay a neighboring curve column.
- Width: This setting establishes the width of the curve column on the log, as a percent of the output dimensions. The greater the value, the wider the column. Default = 1.
- Column Title:
- Automatic: Choose this option for the column to be labeled automatically with the name of the track you selected above.
- Manual: Choose this option to enter your own title for the column. If no title is desired, choose Manual and leave the field blank.
- Font: This establishes the size for the title as a percent of the output dimensions. A smaller size setting creates smaller text characters. You can also define the color and angle.
- Vertical Offset: Determines how far above the column the title will be plotted. If you expect to apply vertical exaggeration of 5x or more to your log or section, you might consider a value of 0.
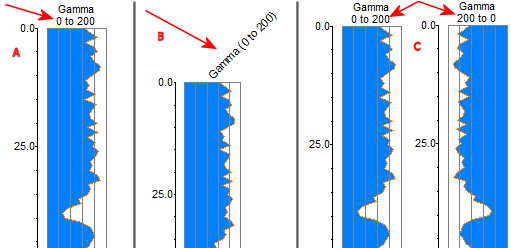
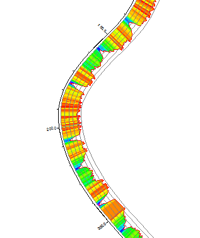
- Include Data Range: Insert a check here to include the min and max values for the column as part of the column.
- If the title angle is 90 degrees, the data range will be inserted between the column title and the top of the striplog (see A below).
- If the title angle is not horizontal, the data range will be inserted in parentheses after the title text (see B below).
- The data range labels will honor the left-to-right / right-to-left orientation of the curve (see C below).
- Perimeter: Insert a check here to border the column with a line style and color that you choose.
- Subdivisions: If activated, the program will display on the column a series of vertical lines to function as a visual reference for the magnitude of the curve.
- Intervals: This setting adjusts the number of divisions to be represented by the background lines.
- Style: Choose the style and color for the background lines.
- Plotting Sequence: Choose Foreground for the lines to plot on top of the curve, or Background for the lines to plot behind the curve.
- Scaling: This controls how the range of point-data is plotted within the available column width.
- If you choose Automatic, RockWorks will scan the range of value in the specified Track for all of the active boreholes, thus determining the project’s minimum and maximum point-data values sampled. It will then assign the inside of the curve column to the project’s minimum value and the outside of the column to the project’s maximum. Benefits: If you are plotting multiple boreholes, this assures that the data is plotted at the same scale in all logs.
- If you choose Manual, you can establish the point-data value to correspond to the inner (minimum) and outer (maximum) edge of the curve column. Let’s say, for example, that your elog values in all wells ranged from 24 to 142, you might want to set the Minimum to 0 and the Maximum to 150.
! Note that the plotting direction, established below, determines which edge of the column is assigned the minimum value and which is assigned the maximum.
! Note also that if you enter 0 for the minimum and choose Logarithmic scaling, RockWorks will substitute a non-zero value automatically.
- Logarithmic: Insert a check here if you want to plot the natural logarithms of the P-data values.
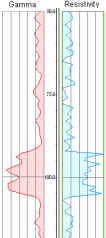
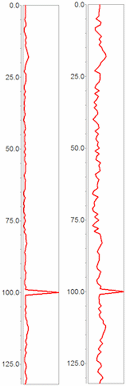
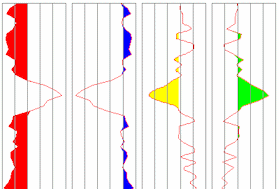
The following diagram illustrates the usefulness of this new capability. Let's pretend that the depths represent meters while the magnitude of the curve represents resistivity in ohms. The magnitude for the p-data curve ranges between zero and 100 ohms except for a single 1,000 ohm value at a depth of 100 meters. The curve on the left shows how the data would appear when using automatic scaling with the new logarithmic option disabled. Notice how the portion of the curve with magnitudes between zero and 100 ohms is flattened. Variations within the zero to 100 ohm range are effectively hidden. Conversely, the curve on the right shows the same data with the new logarithmic option enabled. In this case, the 1,000 ohm spike at a depth of 100 meters is not as pronounced while the zero-to-100 ohm data shows more relative variation.
Computing the natural logarithm of p-data can be problematic when the range of the data is unknown. For example, computing the natural logarithm of zeros or negative numbers will normally cause fatal errors. As a consequence, the following safeguards have been implemented:
- First, the original number is converted to a positive number. This prevents an error condition whereby it's not legal to compute the natural logarithm of a negative number.
- If the original number was negative, the resulting natural logarithm will be converted to a negative number. This means that originally negative data will still be plotted (as opposed to setting these values to zero).
- If the original number was zero, the result will be zero. Admittedly, the natural logarithm of zero is undefined but try telling that to a computer.
- Fill Options
- Fill Region within Curve: This check-box setting, if activated, will fill the inside of the curve with a solid color.
- Monochrome: Choose this to fill the curve with a single color. Click the color box to choose the fill color.
- Gradational: Choose this option to fill the curve with a color gradation.
- Low: Click the color box to choose the color to be used to represent low values.
- High : Click to choose the color to be used to represent high values. Intermediate values will grade between these colors.
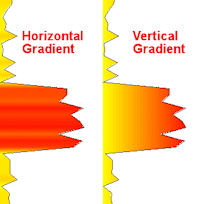
- Color Gradient Direction:
- Horizontal: Choose this option to grade the color in horizontal bands down the curve.
- Vertical: Choose this option to grade the color in vertical bands from min to max across the curve.
-
-
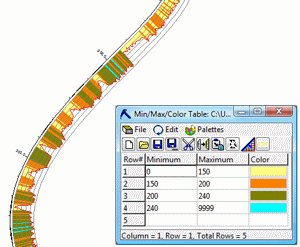
- Based on Lookup Table: Choose this option to fill the curve with colors based on a user-created color table. Expand this heading to browse for the color table or create a new one. (See Color Tables for details.)
- Fill Style:
- Fill Entire Curve: Choose this option if the entire curve is to be filled.
- Only Fill Portion Above Cutoff: Click in this radio button if only the upper portion of the curve is to be filled, as a means of highlighting areas of interest. Expand this heading to establish the Cutoff Level. Portions of the curve that exceed this value will be filled with the color specified above.
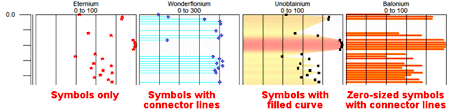
- Plot Line: This, if activated, will plot the curve line in the selected line style, thickness, and color. You can use fill only, line only, or both line and fill (with different colors, if you wish).
- Plot Symbols: Check this box if symbols are to be displayed at the curve vertices.
- Symbol Type: Click the button to choose the symbol style.
- Symbol Size: Click to the right to type in the size, in your output dimensions, for the curve symbols. (default = 0.1)
-
- Connector Lines: Check this box to include lines from the Symbols to the curve edge. Expand this heading to define the line style, color, and thickness.
-
- Direction:
- Left-to-right: Click in this button if the minimum value is to coincide with the left edge of the column and the maximum value with the right edge. The data will plot left-to-right.
- Right-to-left: Click in this button if the minimum value is to coincide with the right edge of the column and the maximum value with the left edge. The data will plot right-to-left.
 Back to 2D Striplog Options

RockWare home page