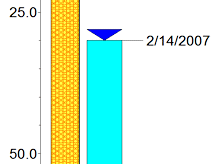
Use the Striplog Aquifers check-box to display one or more filled blocks in your logs representing the top and base depths of all of your aquifers. Insert a check in the Aquifers Text check-box to plot the water level measurement dates and aquifer names. When you click on the Aquifers or Aquifers Text items in the layout window you’ll see the following settings in the pane to the right. Note that you can activate the fill column and text independently.
The aquifer name and depth data are read from the Borehole Manager's Water Levels data table. The color and patterns for each aquifer are read from the Aquifer Types table.
Aquifer Data
Aquifer Text
- Column Layout
- Left Margin: Determines the space between the aquifer text column and the item to its left, as a percent of the project output dimensions. The greater the value, the wider the space. Default = 0.
- Width: This setting establishes the width of the text column, as a percent of the output dimensions. The greater the value, the wider the column. Note that you may have to adjust this if you activate a number of the text fields, below. Default = 1.
! Text does not wrap within this column - it's designed for short labels.
- Column title: Click here to enter text to be displayed above the aquifer text column. If no title is desired, you can leave this field blank.
- Font: This establishes the size for the text title as a percent of the study area dimensions. A smaller size setting creates smaller text characters.
- Vertical Offset: Determines how far above the column the title will be plotted. If you expect to apply vertical exaggeration of 5x or more to your log or section, you might consider a value of 0.
- Perimeter: Insert a check here to border the column with a line style and color that you choose.
- Interval Labeling
- Font: Establishes the size for the aquifer text as a percent of the output dimensions. A smaller size setting creates smaller text characters. Default = 0.5
- Borders: Check this to include solid line borders around the water level text. Be warned that any long text labels may extend outside a too-narrow column. If this happens, increase the column size and/or decrease the font size, above.
- Centered: Check this to display the aquifer captions as centered vertically in their intervals. If left unchecked, the captions will plot at the top of the interval.
- Leader Lines: Check this box to include a line between the caption and the top and base of the aquifer block.
-
- Aquifer Name: Check this box to display the aquifer name in the text column.
- Sampling Dates: Check this box to display the date in the column.
- If only the patterns are being plotted, and the Centered option is checked, the text will be plotted at the interval midpoint.
- If only the symbols are being plotted, and the text Border option is unchecked, and the Centered option is unchecked, the text will be vertically centered at the top of the interval.
- If only the symbols are being plotted, and the text Border option is checked, and the Centered option is unchecked, the text will be plotted directly below the top of the interval.
- If only the symbols are being plotted, and the text Border option is checked, and the Centered option is checked, the text will be plotted at the interval midpoint.
- If both symbols and patterns are being plotted, and the text Border option is unchecked, and the Centered option is checked, the text will be vertically center within the interval.

 Back to 2D Striplog Options

RockWare home page