
RockWorks | ModOps | Solid | Extract Grids | Solid -> Zone Grids
This program will extract all of the voxels from a solid model that reside, in whole or in part between a series of specified grid (surface) pairs, perform the selected statistics calculations on them, and then save the result within the specified output grids. The names of the input and output RockWorks grid models are read from the Datasheet. The calculations can represent:
- Grade values: Extract the highest value, lowest value, average, median, most frequently occurring, sum of corresponding values within the specified zone in the solid model (i.e. all nodes which fall between the surfaces). Or...
- Elevation values: the highest elevation for the highest or lowest G value, or the lowest elevation for the highest or lowest G value. This allows you to view an elevation distribution of the model values.
If desired, ESRI-compatible shapefiles will also be generated based on the name of the output grids.
See also
Solid -> Grid to extract a single grid from a solid model
Solid -> Grids to extract multiple grids based on (planar) elevation ranges.
Feature Level: RockWorks Basic and higher
Menu Options
Step-by-Step Summary
- Data Columns: Use these prompts to define the columns in the datasheet where the input and ouptut grid file names are listed.
- Input
- Upper Grid: Select the column in the current datasheet where the names of the upper grid models (RwGrd files) are listed.
- Lower Grid: Select the column where the names of the lower grid models are listed.
- Output
- Output Grid: Select the column where the name of the output grid files are listed. These will be the RwGrd files containing the statistics summary, output from this program.
- Input Model
- Solid Input File: Click to the right to browse for the name of the existing RockWorks solid model (.RwMod file) that the program is to read and process for the grid models.
- Type of Conversion: Click this tab to select the desired solid -> grid conversion.
- Average G Value: Select this option to compute the average of the node G values in each vertical column of the solid model, and store that average value in the corresponding grid node.
- Highest Elevation of Highest G Value: Select this option to determine the highest G value in each vertical column model nodes, and store the uppermost elevation for that value in the corresponding grid node.
- Highest Elevation of Lowest G Value: Select this to determine the lowest G value in each vertical column model nodes, and store the uppermost elevation for that value in the corresponding grid node.
- Highest G Value: Select this to create a grid model in which the highest G value in each vertical column of model nodes is stored in the corresponding grid node.
- Lowest Elevation of Highest G Value: Select this to determine the highest G value in each vertical column model nodes, and store the lowermost elevation for that value in the corresponding grid node.
- Lowest Elevation of Lowest G Value: Select this to determine the lowest G value in each vertical column model nodes, and store the lowermost elevation for that value in the corresponding grid node.
- Lowest G Value: Select this option to create a grid model in which the lowest G value in each vertical column of model nodes is store in the corresponding grid node.
- Median G Value: Choose this to compute the median node G value in each vertical column of the solid model, and store that G value in the corresponding grid node. The statistical median is the number separating the higher half of the sampling from the lower half. It is often a better representation of the "average" (versus the mean) when a distribution is skewed by outliers.
- Most Frequently Occurring G Value: Choose this option to compute the most frequently occurring node G value (the mode) in each vertical column of the solid model, and store that G value in the corresponding grid node. Note: This doesn't work well for multimodal populations (i.e. vertical columns where there are "ties" for the most frequently occuring G values). In these cases, the program will arbritarily choose the first candidate. Also note that selecting this option will require significantly more time for performing the solid-to-grid conversion.
- Number of Non-Null Nodes: Select this option to count the number of non-null (not equal to -1.0e27) G values in each vertical column of the solid model, and store that count in the corresponding grid node.
- Number of Null Values: Select this to count the number of null (=-1.0e27) G values in each vertical column of the solid model, and store that count in the corresponding grid node.
- Standard Deviation of All G Values: Select this option to compute the Standard Deviation of all the non-null nodes within each version column of the solid model, and store that count in the corresponding grid node. With some data sets, this number is an approximation of the vertical anisotropy (i.e. square root of variance).
- Sum of all G Values: Select this option to compute the sum of the nodes in each vertical column of the solid model, and store that summed value in the corresponding grid node.
- Weighted Arithmetic Mean: Select this option if the grid nodes are to represent a weighted arithmetic mean of the vertical column of model nodes:
Z = Sum ( G x Voxel_Height ) / Sum ( Voxel_Height )
- Weighted Harmonic Mean: Select this option if the grid nodes are to represent a weighted harmonic mean of the vertical column of model nodes:
Z = Sum ( Voxel_Height ) / Sum ( Voxel_Height / G )
- Create Shape Files: Check this item to output the resulting grid models to Shapefile format. The naming convention is such that if the output grid is named "Potosi_Zone.rwGrd", then the following Shapefiles will be created: Potosi_Zone.dbf, Potosi_Zone.shp, and Potosi_Zone.shx.
- Replace Null Values: Check this if null values in the output grids are to be replaced by another value. Type that value into the prompt box.
- Export As...
- Elevations (Point Z): Choose this if the Z values represent Elevations.
- Values (Point): Choose this if the Z values represent the G values of the model.
- Be sure you have an existing solid model and extraction zone grid models already created, for input into this program.
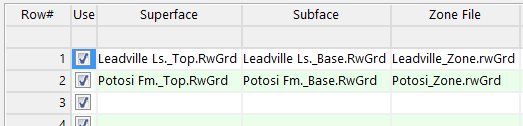
- Create or open an existing datasheet which lists names of the existing upper and lower grid files which will comprise the top and base of each extraction zone, and the name of the output zone grid model. Here is an example:
- Select the ModOps | Solid | Extract Grids | Solid -> Zone Grids menu option.
- Enter the requested menu settings, described above.
- Click the Continue button to proceed.
RockWorks will read the input solid model file, and for each column of node values, for each zone between the surfaces, it will perform the requested data computation, storing the result as the Z value for that X,Y node location in the output grid file. This process is repeated for each column of nodes in the source file and each defined zone. The completed grid files will be stored in the project folder using the listed grid file name. If requested, the grid models will be output to Shapefiles usng the naming convention described above.
- You can adjust any of the settings in the main Options tab to the left and then click the Continue button again to regenerate the diagram(s).
 Back to Solid Menu Summary

RockWare home page