RockWorks | ModOps | Solid | Extract Grids | Solid -> Grids
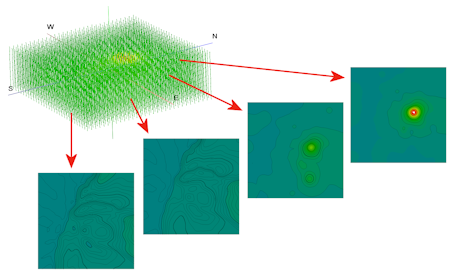
Given a solid model, this program will create a series of grid models, for specific elevation ranges, in which the z-values represent:
- Grade values: Extract the highest value, lowest value, average, median, most frequently occurring, sum of corresponding values within the specified elevation range within the solid model (i.e. all nodes which fall within the same vertical region). Or...
- Elevation values: the highest elevation for the highest or lowest G value, or the lowest elevation for the highest or lowest G value. This allows you to view an elevation distribution of the model values.
An example application is to produce a series of sub-surface high-concentration contour maps of contaminant plumes at elevation increments.
This program generates the grid models only, and it assigns a name automatically. It does not offer display options, just grid model output. See the Grid | Display program to display the output grid models as a map or 3D surface.
See also:
Solid -> Grid to extract a single grid from a solid model
Solid -> Zone Grids to extract multiple grids based on surfaces (e.g. stratigraphic zones).
Feature Level: RockWorks Basic and higher
Menu Options
Step-by-Step Summary
- Options
- Input Solid Model: Click to the right to browse for the name of the existing RockWorks solid model (.RwMod file) that the program is to read and process for the grid models.
- Root Name for Output Grids: The grids will be named according to the Root Name and the midpoint elevation. For example, if the Root Name is "Level_" and the Starting Elevation is 193, then the first grid will be titled "Level_193.RwGrd".
- Starting Elevation: Enter the starting (lowest) elevation for the data to be extracted from the model.
- Final Elevation: Enter the ending (highest) elevation for the data to be extracted from the model.
- Elevation Increment: Enter the increment between the starting and ending elevations at which the model is to be sampled.
- Sampling Thickness: This is usually the same as the Elevation Increment, but it can be increased such that the grids represent overlapping regions within the solid.
- Type of Conversion: Click this tab to select the desired solid -> grid conversion.
- Average G Value: Select this option to compute the average of the node G values in each vertical column of the solid model, and store that average value in the corresponding grid node.
- Highest Elevation of Highest G Value: Select this option to determine the highest G value in each vertical column model nodes, and store the uppermost elevation for that value in the corresponding grid node.
- Highest Elevation of Lowest G Value: Select this to determine the lowest G value in each vertical column model nodes, and store the uppermost elevation for that value in the corresponding grid node.
- Highest G Value: Select this to create a grid model in which the highest G value in each vertical column of model nodes is stored in the corresponding grid node.
- Lowest Elevation of Highest G Value: Select this to determine the highest G value in each vertical column model nodes, and store the lowermost elevation for that value in the corresponding grid node.
- Lowest Elevation of Lowest G Value: Select this to determine the lowest G value in each vertical column model nodes, and store the lowermost elevation for that value in the corresponding grid node.
- Lowest G Value: Select this option to create a grid model in which the lowest G value in each vertical column of model nodes is store in the corresponding grid node.
- Median G Value: Choose this to compute the median node G value in each vertical column of the solid model, and store that G value in the corresponding grid node. The statistical median is the number separating the higher half of the sampling from the lower half. It is often a better representation of the "average" (versus the mean) when a distribution is skewed by outliers.
- Most Frequently Occurring G Value: Choose this option to compute the most frequently occurring node G value (the mode) in each vertical column of the solid model, and store that G value in the corresponding grid node. Note: This doesn't work well for multimodal populations (i.e. vertical columns where there are "ties" for the most frequently occuring G values). In these cases, the program will arbritarily choose the first candidate. Also note that selecting this option will require significantly more time for performing the solid-to-grid conversion.
- Number of Non-Null Nodes: Select this option to count the number of non-null (not equal to -1.0e27) G values in each vertical column of the solid model, and store that count in the corresponding grid node.
- Number of Null Values: Select this to count the number of null (=-1.0e27) G values in each vertical column of the solid model, and store that count in the corresponding grid node.
- Standard Deviation of All G Values: Select this option to compute the Standard Deviation of all the non-null nodes within each version column of the solid model, and store that count in the corresponding grid node. With some data sets, this number is an approximation of the vertical anisotropy (i.e. square root of variance).
- Sum of all G Values: Select this option to compute the sum of the nodes in each vertical column of the solid model, and store that summed value in the corresponding grid node.
- Weighted Arithmetic Mean: Select this option if the grid nodes are to represent a weighted arithmetic mean of the vertical column of model nodes:
Z = Sum ( G x Voxel_Height ) / Sum ( Voxel_Height )
- Weighted Harmonic Mean: Select this option if the grid nodes are to represent a weighted harmonic mean of the vertical column of model nodes:
Z = Sum ( Voxel_Height ) / Sum ( Voxel_Height / G )
- Be sure you have an existing solid model already created, for input into this program.
- Select the ModOps | Solid | Extract Grids | Solid -> Grids menu option.
- Enter the requested menu settings, described above.
- Click the Continue button to proceed.
RockWorks will read the input solid model file, and for each column of node values, for each elevation range, it will perform the requested data computation, storing the result as the Z value for that X,Y node location in the output grid file. This process is repeated for each column of nodes in the source file and each elevation increment. The completed grid files will be stored on disk using the "root" name plus the elevation.
- Use the ModOps | Grid | Display program to display the output grids as a 2D map and/or 3D surface.
 Back to Solid Menu Summary

RockWare home page