RockWorks | Borehole Operations | Lithology | Volumetrics
This program reads an existing lithologic solid model (.RwMod file) and creates a tabular report by computing the total volume or mass for each lithotype as a function of the relative depth/elevation. The resulting computations are displayed in a row-and-column datasheet. Lithology solid models are created in the other Lithology menu options.
! This program requires that you've already created a lithology model (.RwMod file).
Feature Level: RockWorks Standard and higher
Menu Options
Step-by-Step Summary
- Input Options
- Lithology Model: Click on this prompt to browse for the name of and existing lithology solid model (.RwMod). The volume calculations will be based on this model.
- Content: Use these settings to define what type of results will be included within the report. You may select multiple options.
- Nodes: Check this box to have the program list the number of nodes for each unit within each layer.
- Volume: Results will be reported in the cubic units you've defined in your Output Dimensions.
- Mass: Computations are based on the Density Factor declared in the current Lithology Table which declare mass per cubic unit. The output will be in the units you've defined in your Output Dimensions.
- Percent: Computations represent the percent of material within each layer (or bench). Note: This number represents percent by volume - not percent by mass.
- Lithotypes to be included within Report: Choose here whether all of the material types within the Lithology Types Table are to be included in the report, or just those flagged to be included in the legend.
- If your Lithology Type Table lists more materials than are included in your project, there's a tool in that Table's Edit menu that will scan the project database and turn off the materials that aren't represented in the boreholes. The materials aren't removed from the table, they're just "deactivated" from being plotted on the diagram legends. This allows you to keep the diagram legends less cluttered. For this Volumetrics tool, selecting "Only Lithotypes Flagged as 'Show in Legend'" tells the program to represent only those active material types in the volume report, thus not reporting materials with no volume and keeping the report less cluttered.
- Sort by
- Name: Choose this option to have the material types listed in the report in alphabetical order, by name.
- G-value: Choose this option to have the material types listed in the report in numerical order, by G-Value.
- Intervals: These options define the vertical portions of the model that are represented by each row within the volumetric report.
- Every Layer: Each row within the report will represent a layer of voxels within the solid model.
- User-Defined: Each row within the report will be based on a user-specified interval. For example, if the user specifies "50" for the interval, the program will list the volume of each lithotype contained within 50-unit-thick layers within the model. This is analogous to a mine "bench".
- Top-Elevation: Elevation at which to start the report. For example, if the user specifies 4500' for the top elevation and 50' for the interval, the first row within the report will show the volumetrics from 4500' to 4450' in elevation.
- Base-Elevation: Elevation at which to stop the report.
- Interval: Height represented by each row within the volumetric report.
- Decimals: Click on this item to specify the number of decimal places to be represented in the depth intervals in the report, and the volume or mass computations.
- Output Options
Click this tab to define the output format(s) for the report. (More info)
- RwDat (RockWorks): Click in this button if you want the report generated in a RockWorks datasheet (.RwDat) format.
- CSV (Excel): Click in this button if you want the report generated in a CSV file format for use in Excel.
- TXT (Notepad): Click in this button if you want the report generated in a text (.txt) format.
- RTF (Word): Click in this button if you want the report generated in an RTF file format for use in Word.
This program reads an existing lithology solid model file (.RwMod), so it's necessary that you have already interpolated a lithology model using one of the other Lithology menu tools.
- Be sure you've already created the lithology model (.RwMod file) to be used.
- Select the Borehole Operations | Lithology | Volumetrics menu option.
- Enter the requested menu options, described above.
- Click the Continue button to proceed with the computations.
The program will read the selected solid model. For each requested "layer" of voxels in the model, the program will compute the node count and/or volume and/or mass and/or percent of each rock type. If mass was requested, the volumes will be multiplied by the density factor. The resulting report will be generated in the requested formats.
- You can adjust any of the settings in the Options tab and then click the Continue button again to regenerate the report.
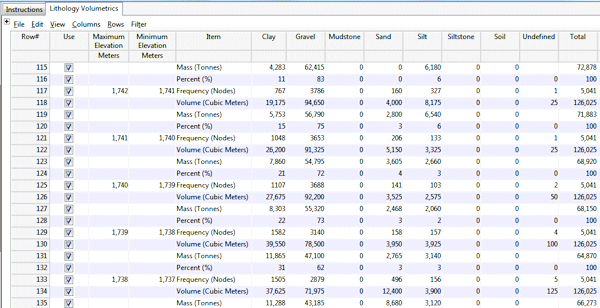
The following example depicts an RwDat output file in which all of the primary options (nodes, volume, mass, & percent) have been enabled.
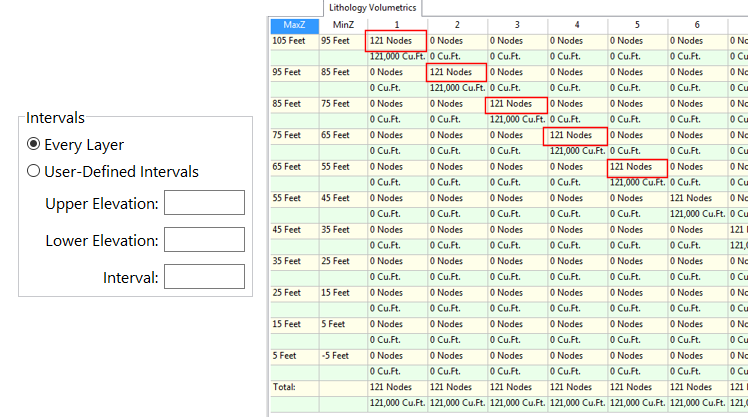
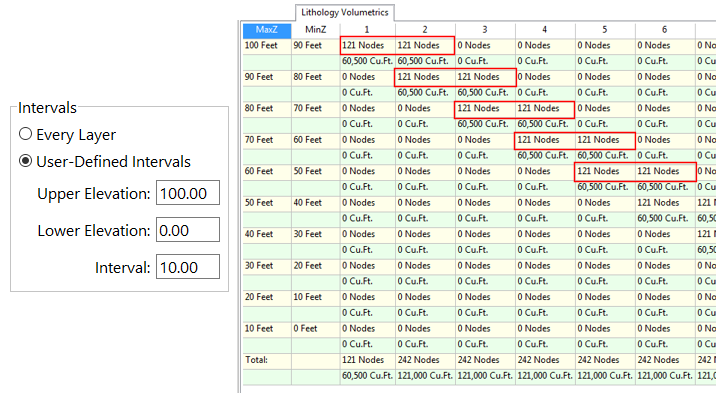
Notes: Be warned that the node count that's reported will be high if you select User-Defined intervals and if the model's nodes are located at the interval boundaries - they'll get counted twice. (Volumes are not affected by this scenario and should be correct.) Compare the following examples for a fictitious solid model that ranges from a coordinate of 0 to 100 on all three axes, with nodes placed at 0, 10. 20. 30 (etc.).
Example 1: Report showing every layer: Report extents are -5 to 105 (all axes), and the nodes lie in the middle of the reporting intervals. Node count is accurate.
Example 2: Report showing user-defined intervals: Report extents are 0 to 100, and the nodes lie on the edges of the reporting intervals. Nodes are counted for two layers.
 Back to Lithology Menu Summary

RockWare home page